This is a preview of your story

Powered by

Storydoc
analytics_default
analytics_default

Israeli High-Tech Human Capital:
A Snapshot

The report was authored by Uri Gabai, Assaf Patir, Eynav Ehrlich and Nir Dar from the Start-Up Nation Policy Institute, and Assaf Kovo from the Israel Innovation Authority. Special thanks to Riki Kaduri and Tal Enselman of the Central Bureau of Statistics for their significant contributions to the report.

expand_more

Partners

Israel Innovation Authority
The Innovation Authority is a statutory public entity responsible for Israel’s innovation policy. The Authority was established in 2016 on the basis of the Office of the Chief Scientist in the Ministry of Economy and Industry. The Authority promotes innovation as a lever for inclusive and sustainable economic growth from the perspective that innovation is the most significant growth engine for the Israeli economy. The Authority works to strengthen the infrastructure on which the Israeli knowledge industry is built, while constantly examining the obstacles and opportunities in the Israeli innovation ecosystem. It offers entrepreneurs and innovation- oriented companies in Israel a variety of financing tools to help them cope with the changing needs of the modern world of innovation. The activity to increase human capital for high-tech is led by the Authority through the Societal Challenges division.

Start-Up Nation Policy Institute
Start-Up Nation Policy Institute is an independent think-tank that works to strengthen the Israeli innovation ecosystem through research and policy recommendations. The Institute works in partnership with the public sector and the high-tech industry to advance policies that maintain Israel’s technological edge and expand Israeli innovation to all areas of its economy & society. The Institute is part of the Start-Up Nation Central group and is fully funded by philanthropy.

Ethosia
Ethosia works to contribute, influence and pave the way for a better world of employment for employers and employees. For the past two decades, the company has provided a wide range of human resources and research services based on professional and skilled human capital, rich datasets and advanced technologies. Ethosia accompanies and assists organizations in the high-tech, life sciences and financial industries in recruitment, senior staffing, employee support and outsourcing. Ethosia’s research unit provides advanced solutions to the complex issues posed by the modern employment world.

Israeli high-tech is in a period of rapid change for the third year in a row

exit_to_app
10.1%

of high-tech workers resigned
(H2 2021)

work
32.9k

Open positions
(April 2022)

trending_up
+12%

Increase in the number of employees
(2021)

Key Findings and Trends to Follow

Halfway through 2022, we can already say that Israeli high-tech is in a period of rapid change for the third year in a row. 2020 began with signs of a crisis, with the unprecedented global pandemic and fear of the collapse of Israeli high-tech, yet it ended with the industry’s accelerated growth. The trend continued throughout 2021 until mid-2022, changing direction due to the plausible recession in the U.S., a bearish stock market, and cooling off in the Israeli high-tech sector.

This report analyzes the aforementioned period of rapid growth. During that time, Israeli tech companies registered record breaking figures with VC investments of $27 billion, and dozens of IPOs and new unicorns. The high-tech labor market – the focus of this report – reached a boiling point with a 12% increase in the number of employees, an addition of 30,000 workers to the industry. Local firms registered the highest growth in number of employees (14%), while R&D centers of multinational companies increased their recruitment by just 5%. Amongst local firms, the most significant growth in recruitment (30%) was registered in “growth” firms (unicorns, companies that IPO-ed in the last decade, and companies that are part of the Growth Companies’ Forum). Once again, the software-based sectors within Israeli high-tech increased their recruitment more than the hardware-based ones. A notable exception was the Cleantech and AgriFood-tech sectors which grew significantly, likely due to the growing interest in alternative proteins.

Accordingly, the demand for employees in the surveyed period was very strong – certainly compared to COVID times but also compared to 2019. In April 2022 a record-breaking figure of 32,900 open positions was registered, two thirds of them for tech positions (it is important to note that this survey was conducted after the onset of the Russia-Ukraine war, and after the shares of public tech companies started falling). The biggest increase was in the number of open positions for non-tech roles, which more than doubled compared to previous years. 84% of the firms reported recruiting employees in the second half of 2021 – similar to the figure from previous years – but almost all of them (85%) reported they struggled to recruit R&D employees, 20% higher than last year.

In April 2022 a record-breaking figure of 32,900 open positions was registered, two thirds of them for tech positions. The biggest increase was in the number of open positions for non-tech roles, which more than doubled compared to previous years.

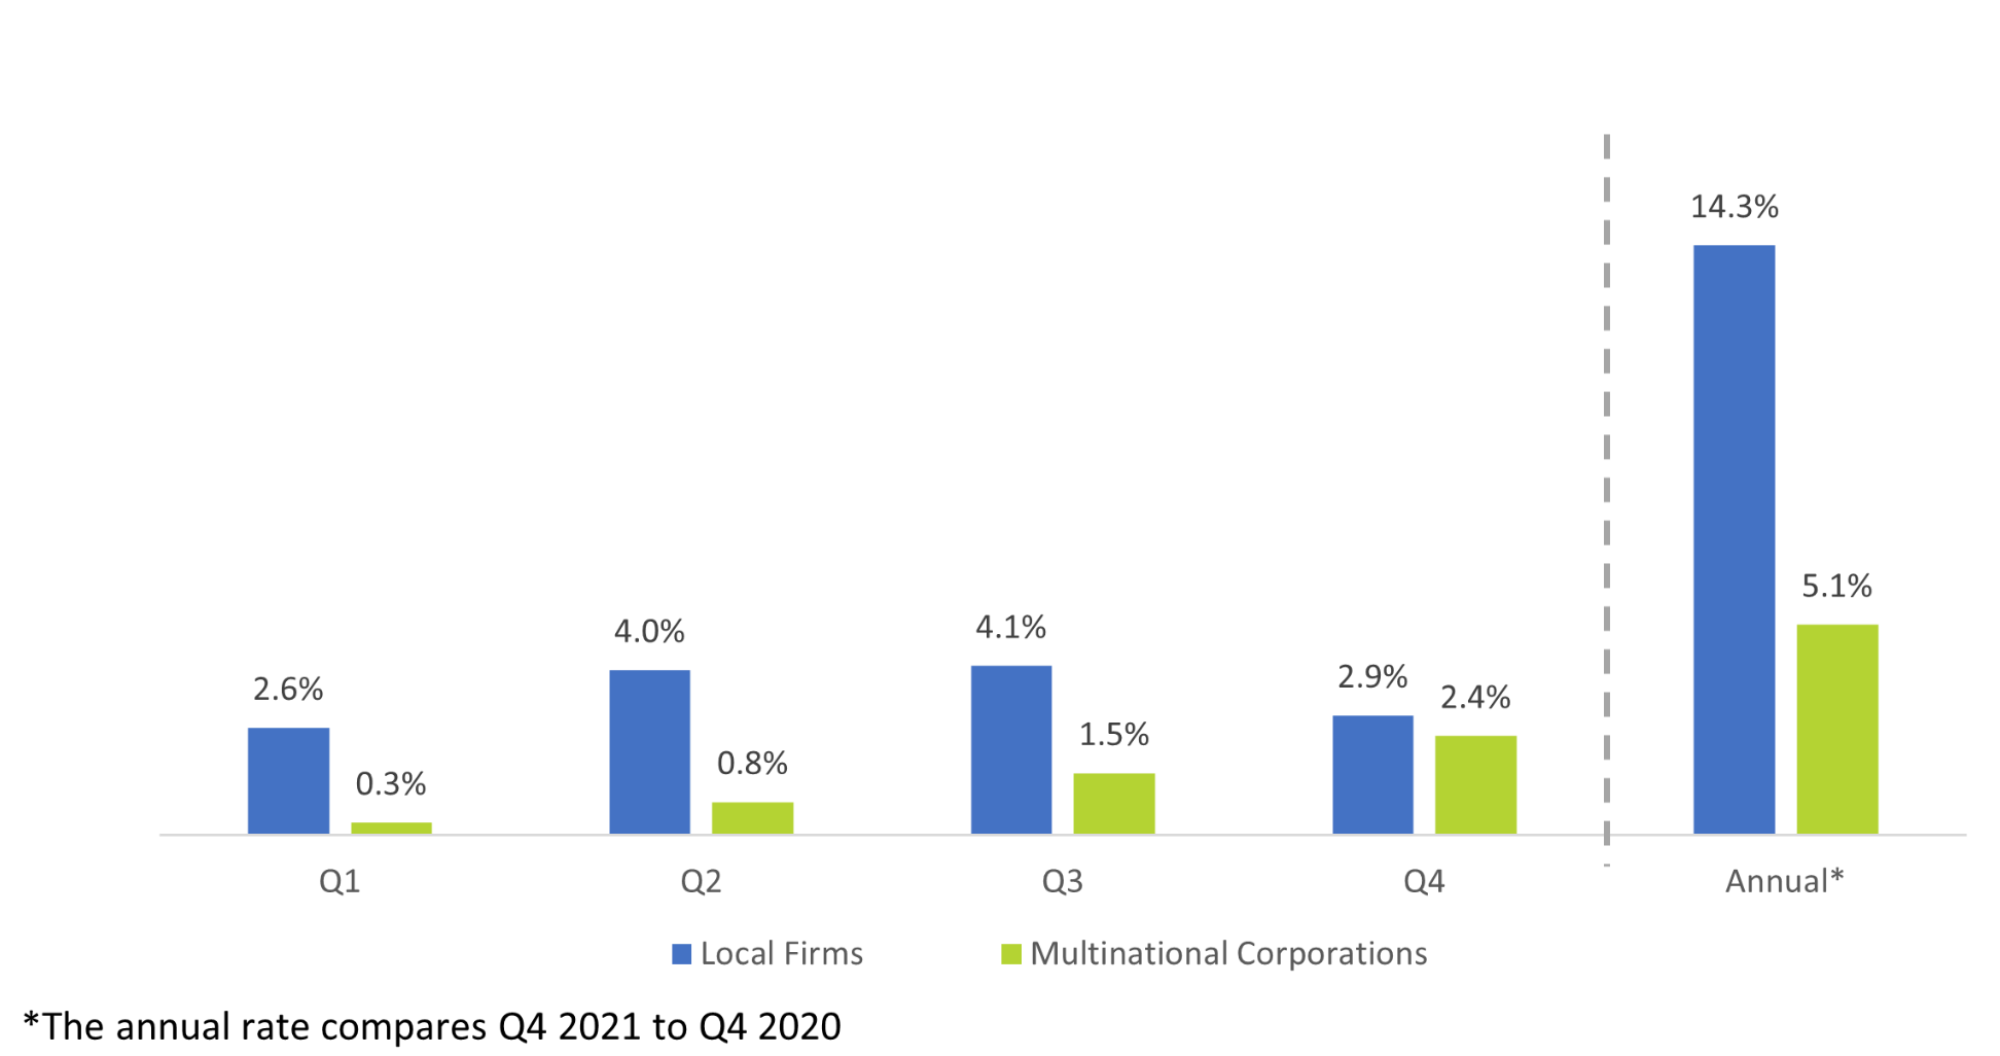
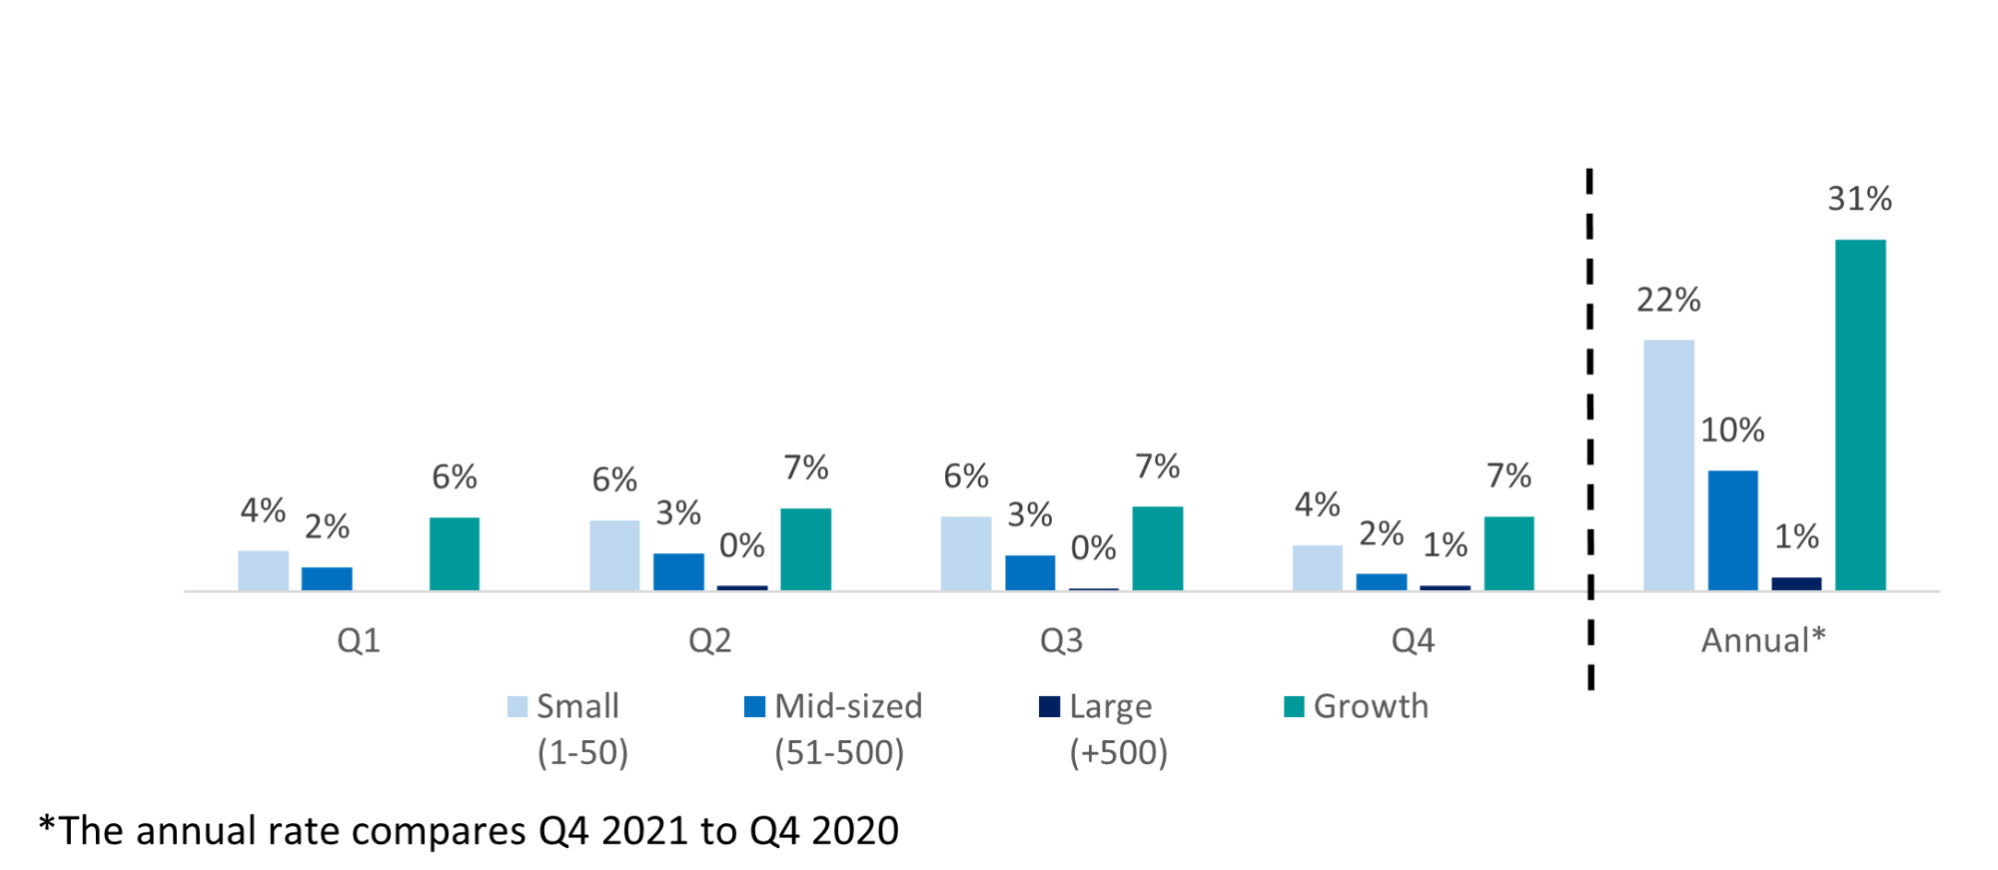
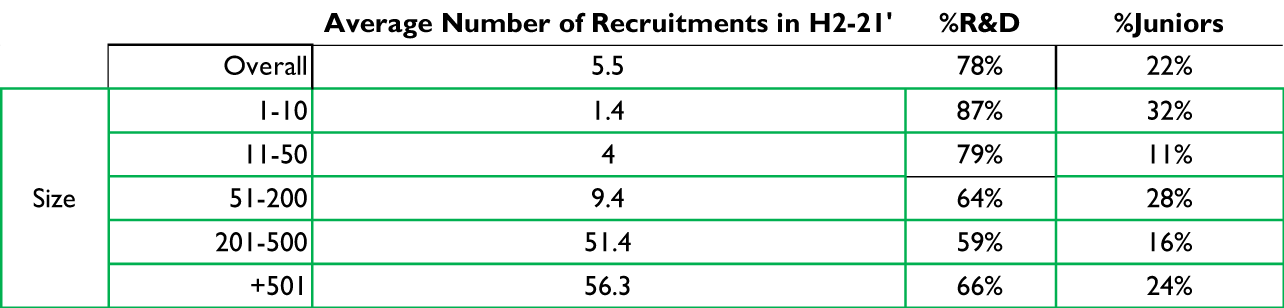
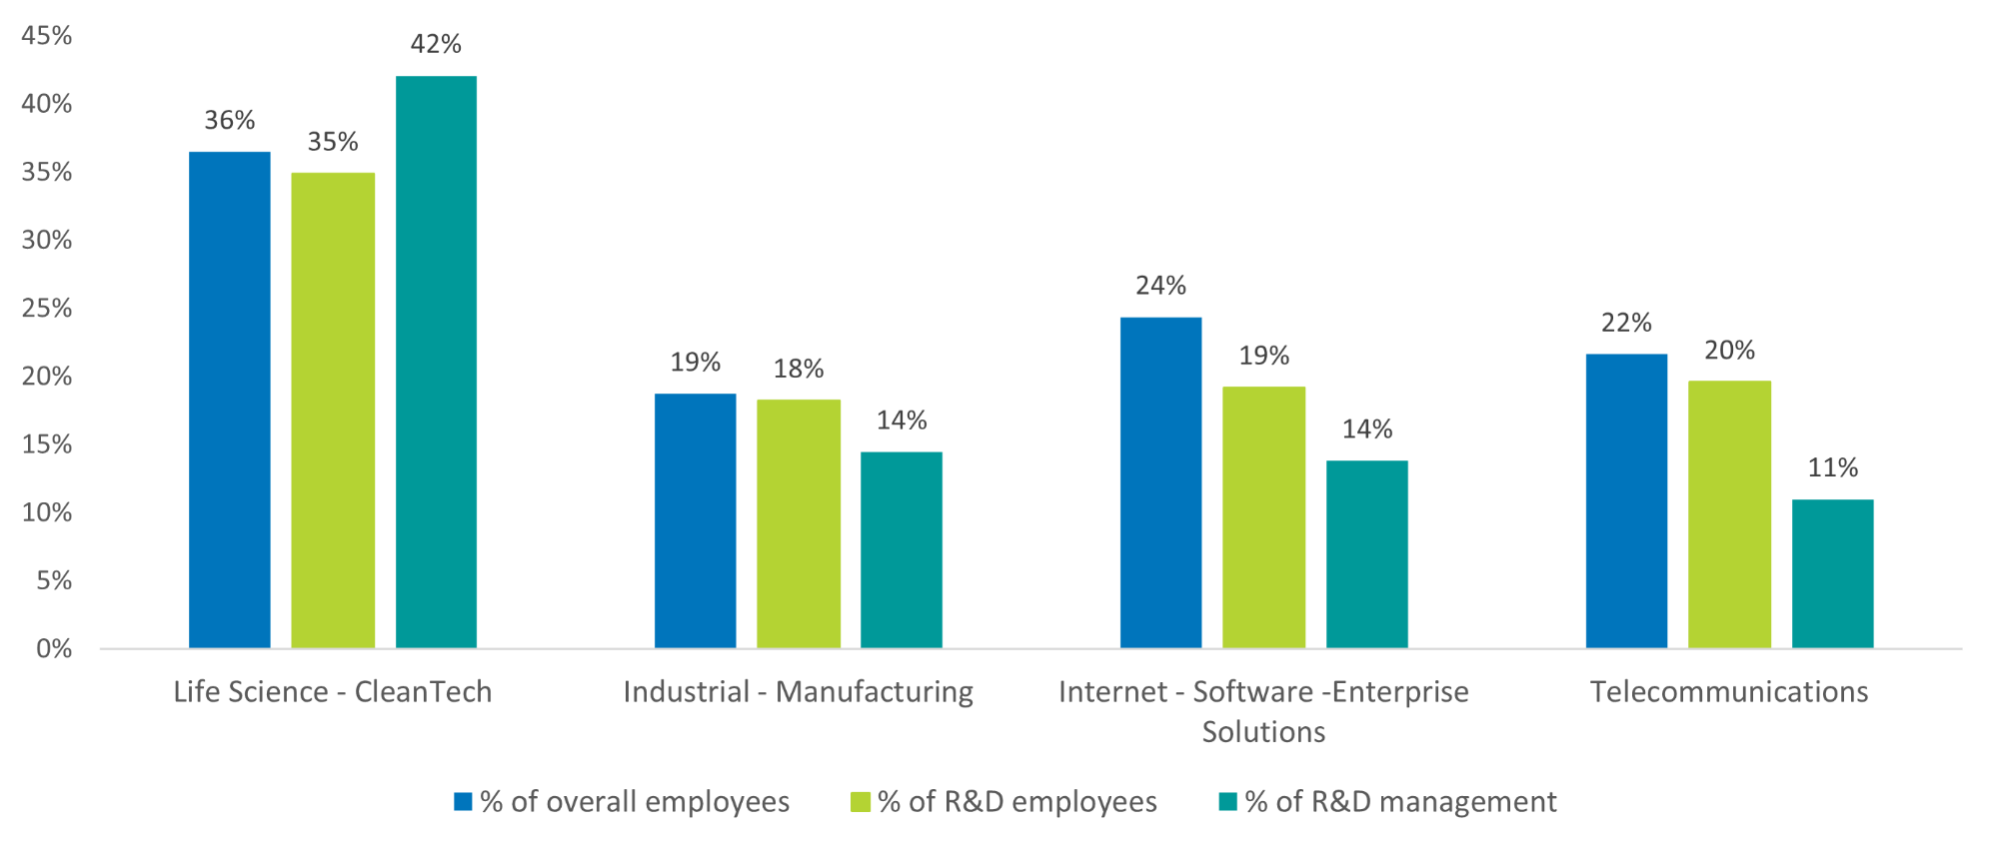
One of the central trends arising from this report is the maturation of the industry, evidenced by the growing share of Israeli “growth” companies. On the one hand, as mentioned, these companies led the growth in recruitment in 2021. That said, they are still relatively young and more sensitive to market volatility. An example of this can be seen in their reaction to the state of the market, expressed in the rate of recruitment for 2020-2021 – a period of crisis followed by a peak year. This segment of the ecosystem is very important to the Israeli economy, as these companies tend to hire across a larger and more diverse array of professions, especially for non-tech roles (35% of employees in local growth companies fill non-tech roles, compared to 20% in the R&D centers of multinational companies). Given the role of the local growth companies in the Israeli economy, it is important to track how they respond to the current crisis developing in the markets.

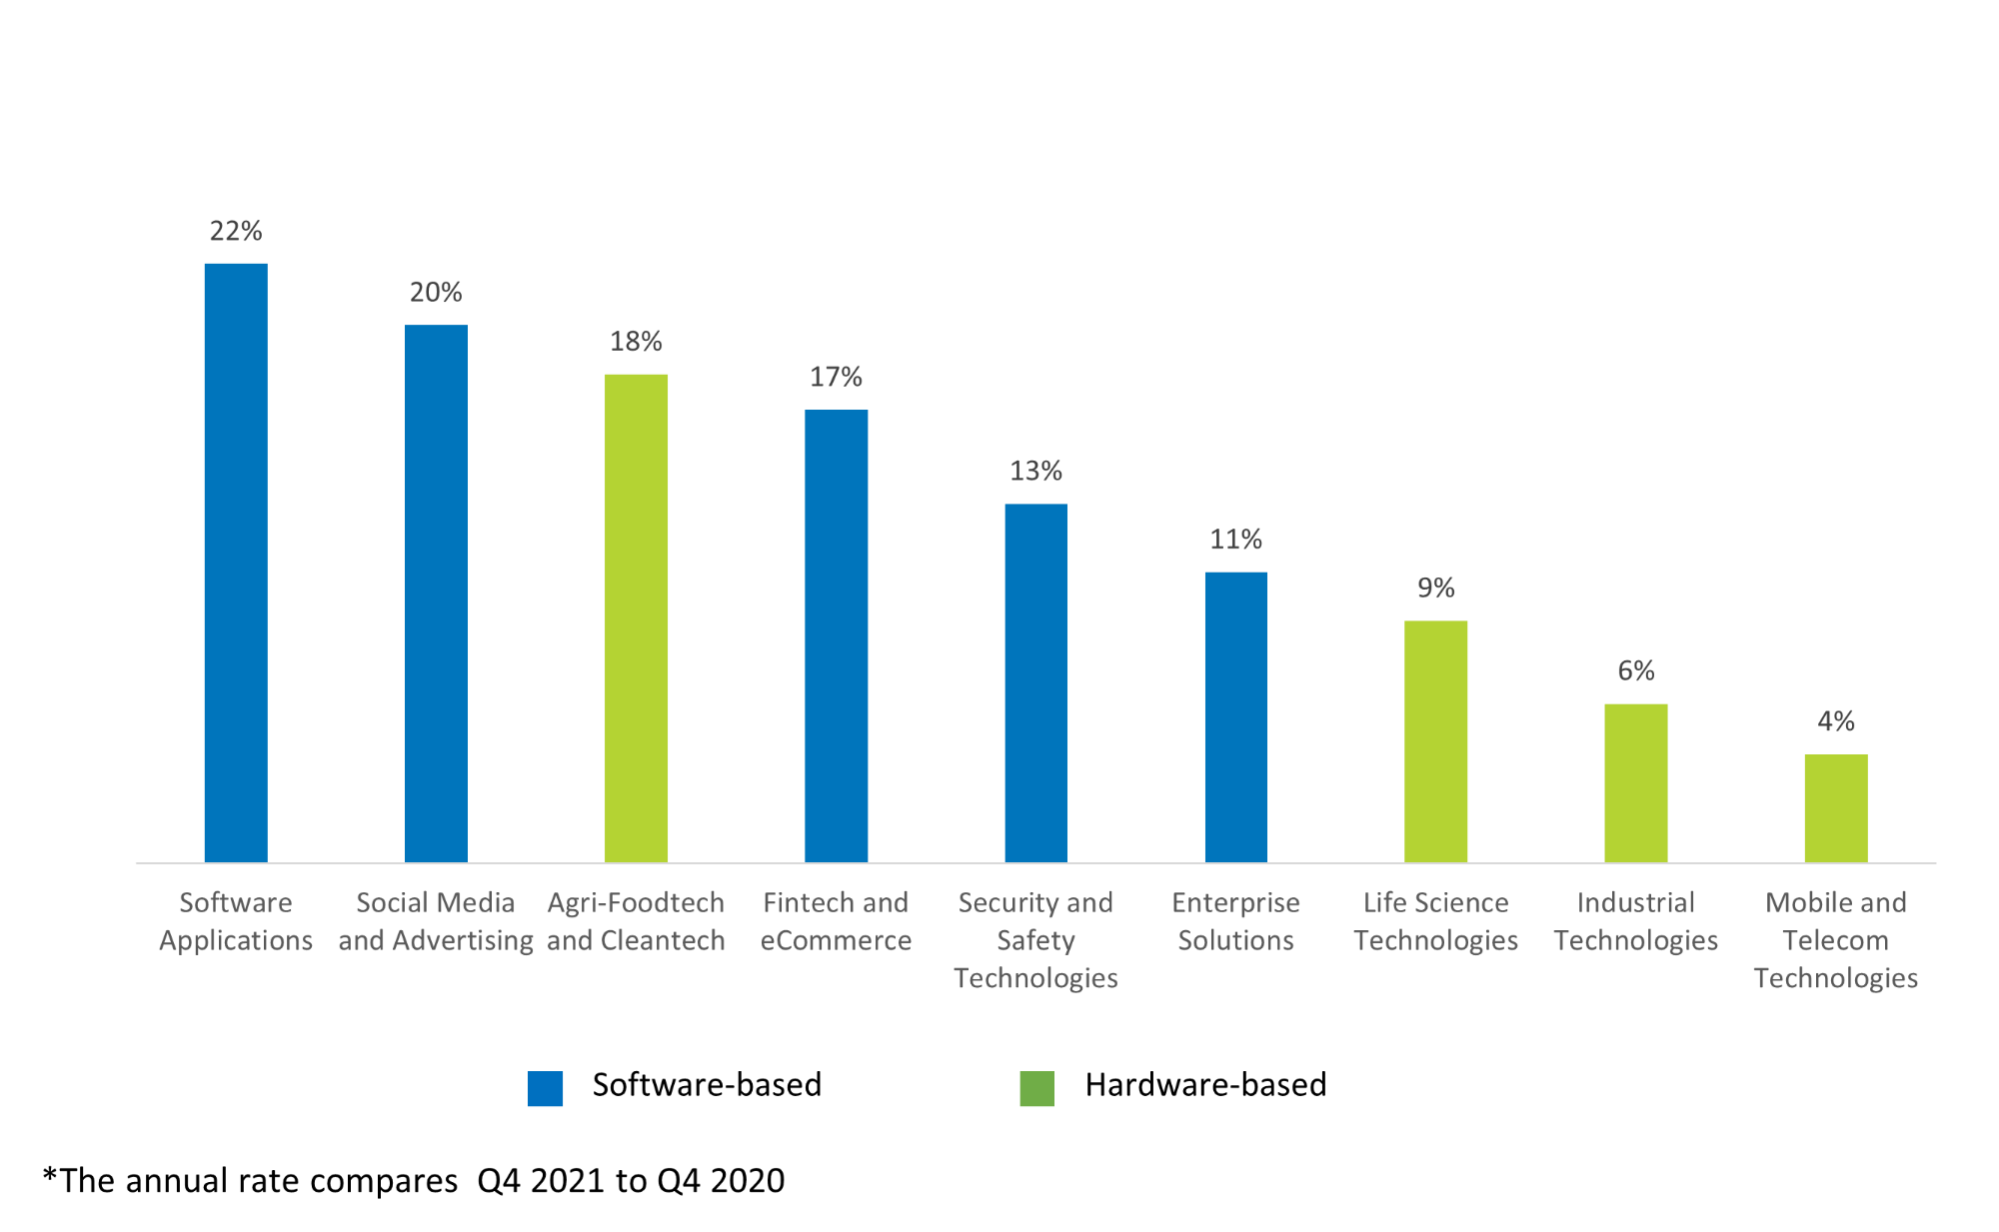
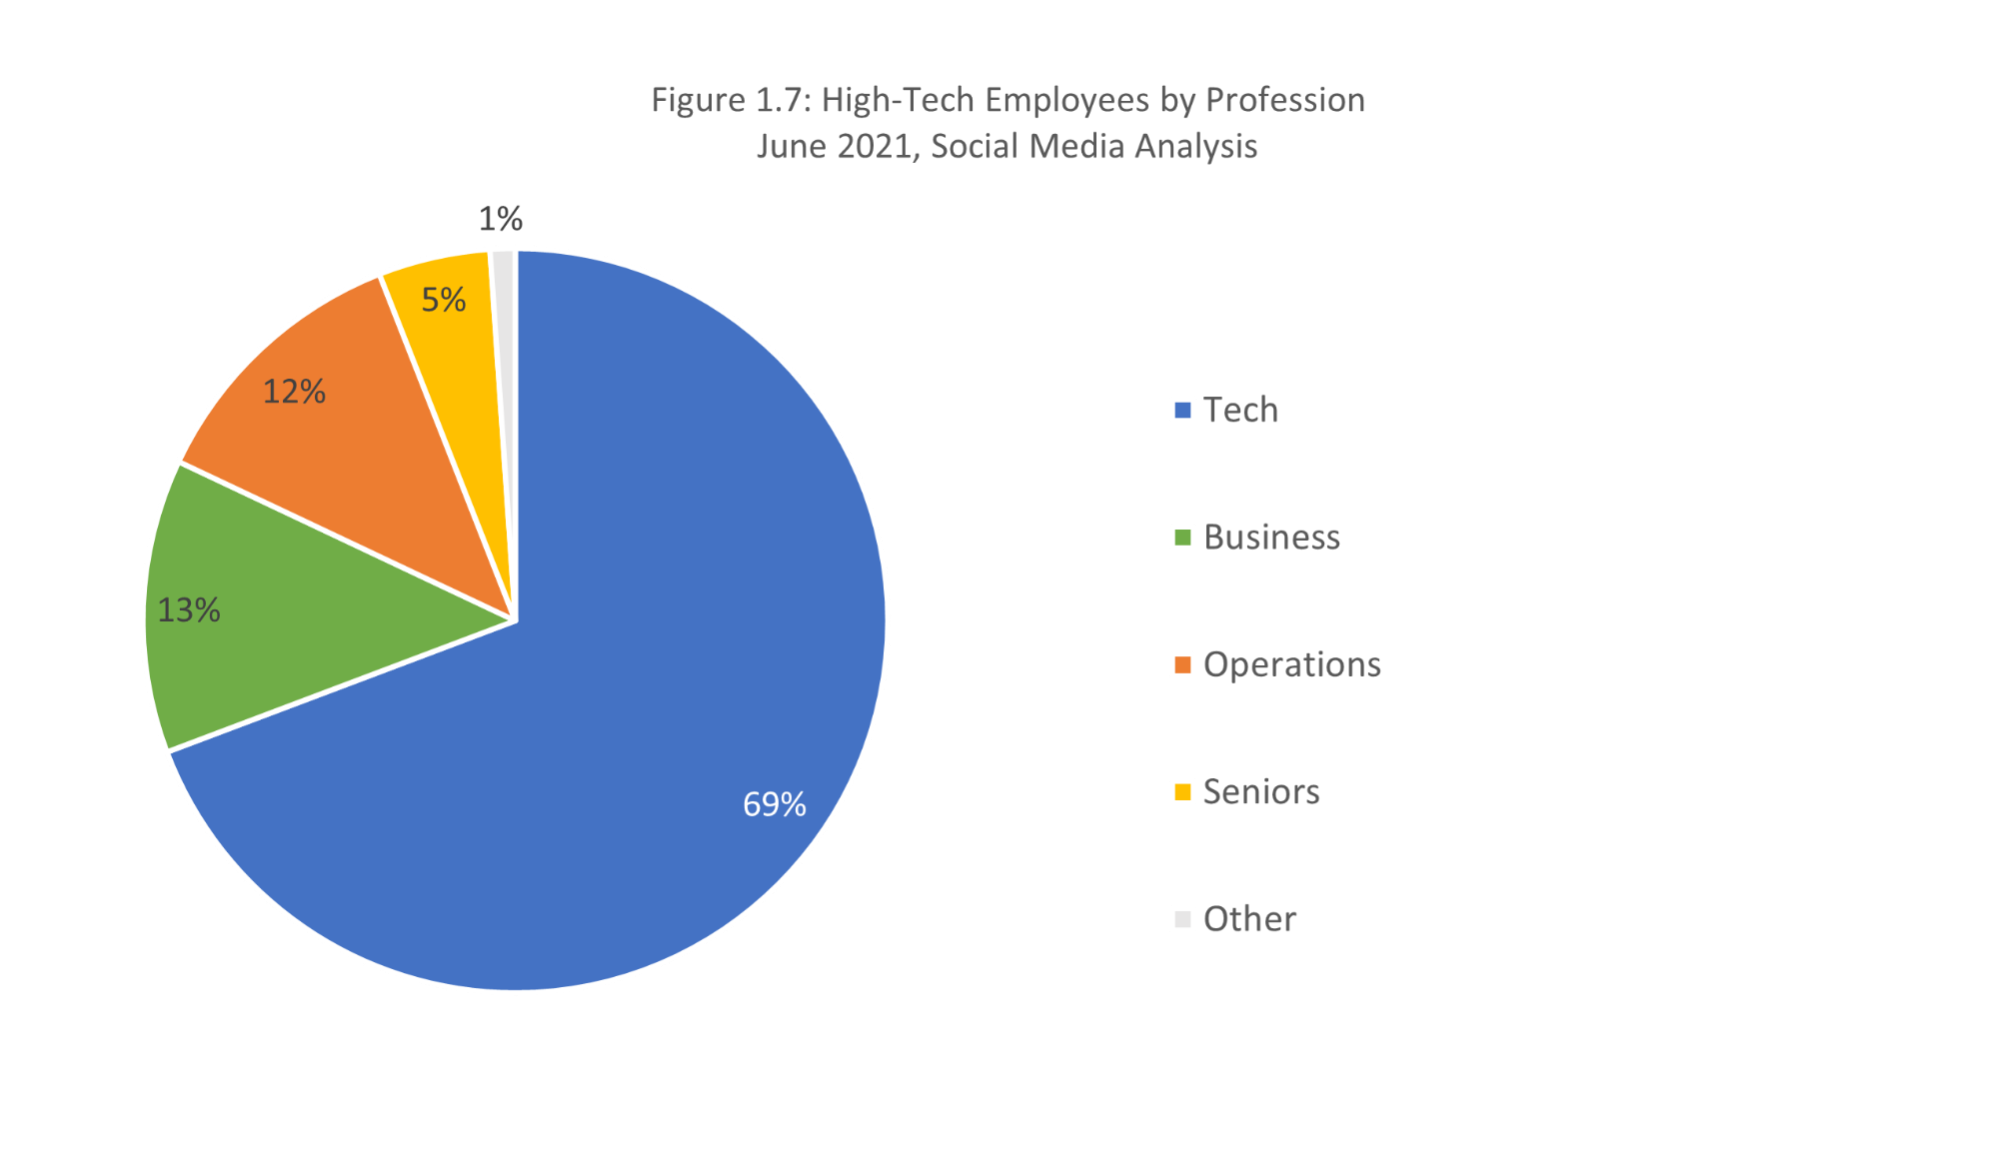
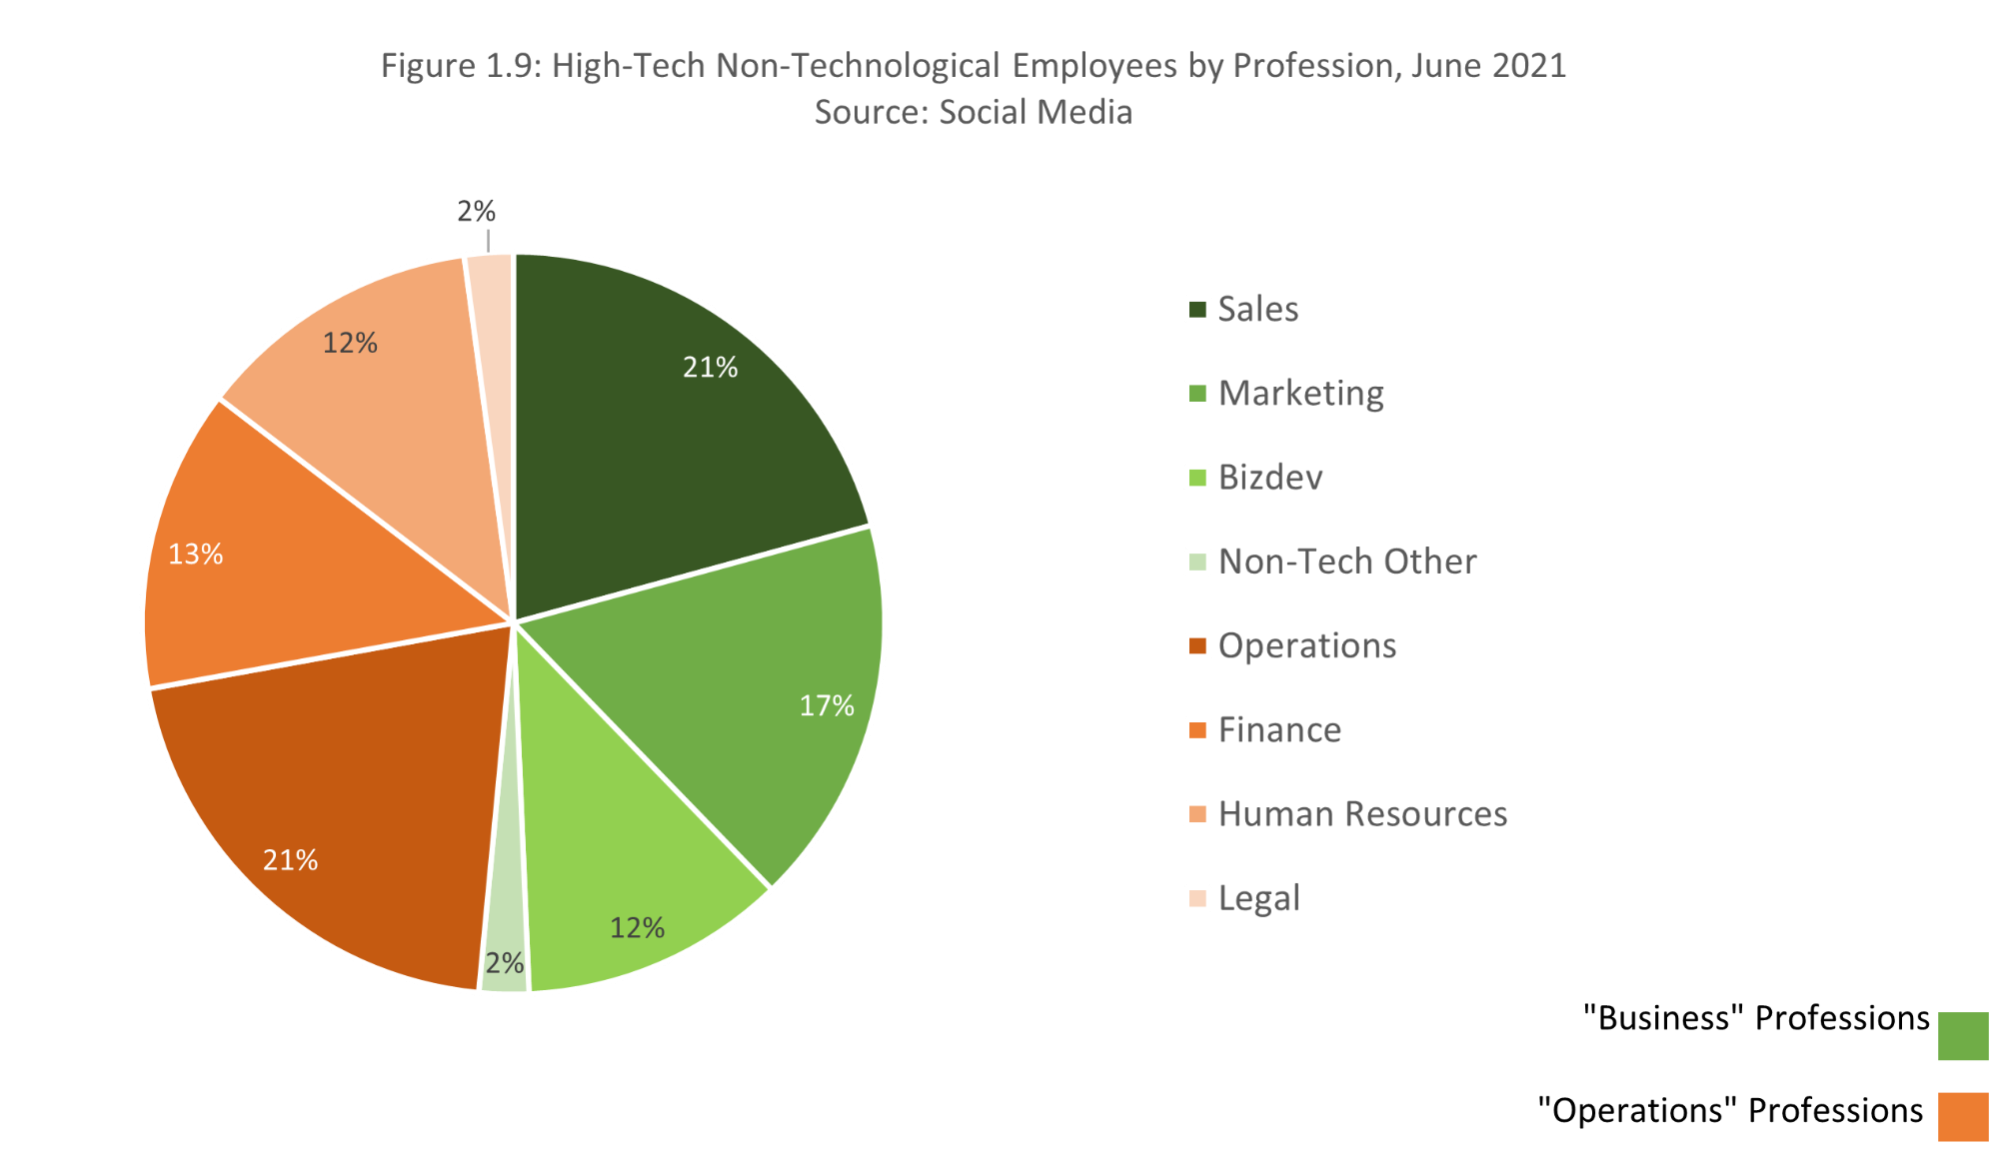
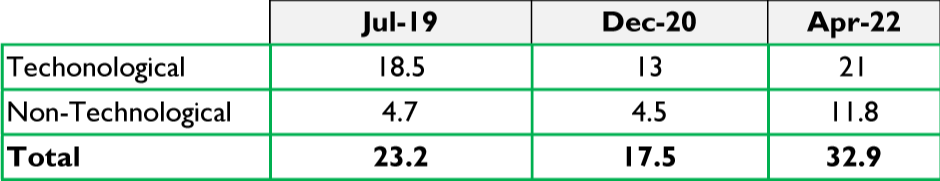
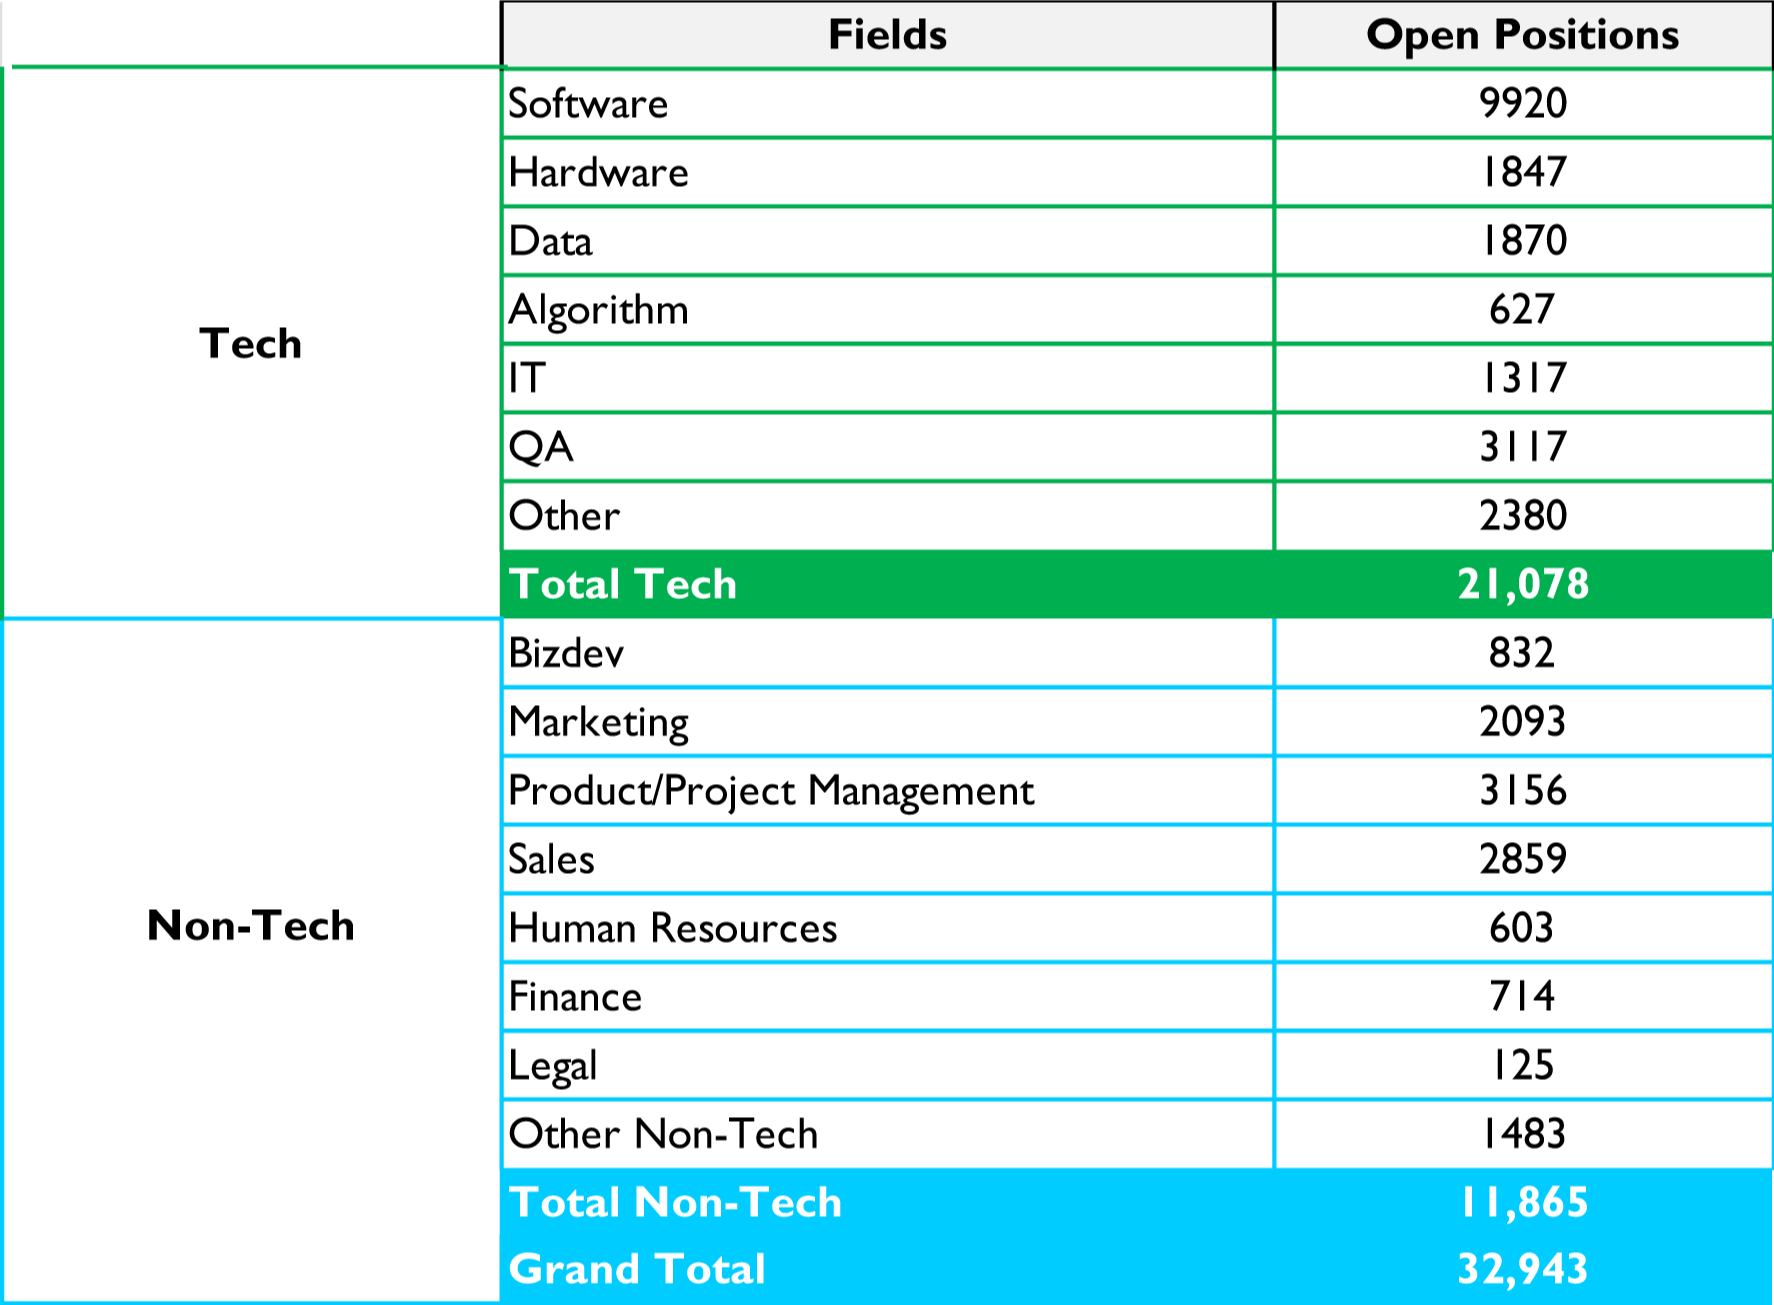
Indeed, opportunities for people without tech training in the Israeli high-tech sector are growing. The data show that the majority of the increase in the number of open positions were for non-technical roles, that increased from 4,500 in 2020 (similar to 2019), to 11,800 – a more than 2.5x increase. This, while the number of open technological roles grew at a slower rate. Alongside this, 70% of high-tech workers are still employed in technological roles that form the core of the industry.

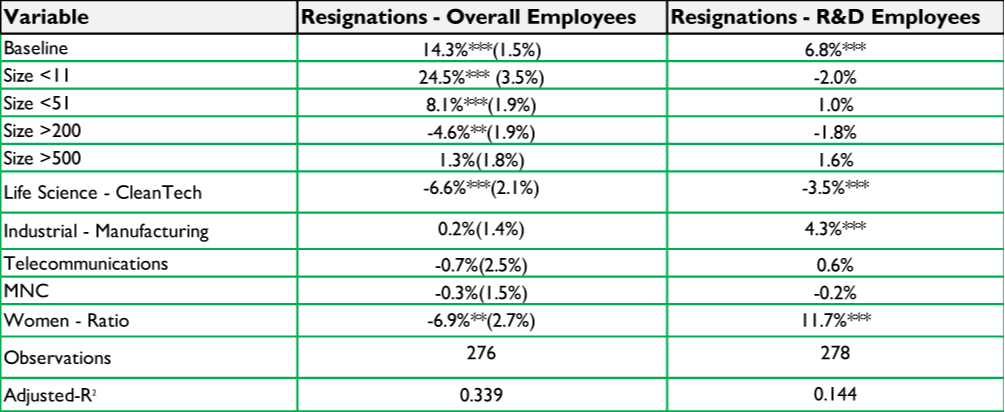
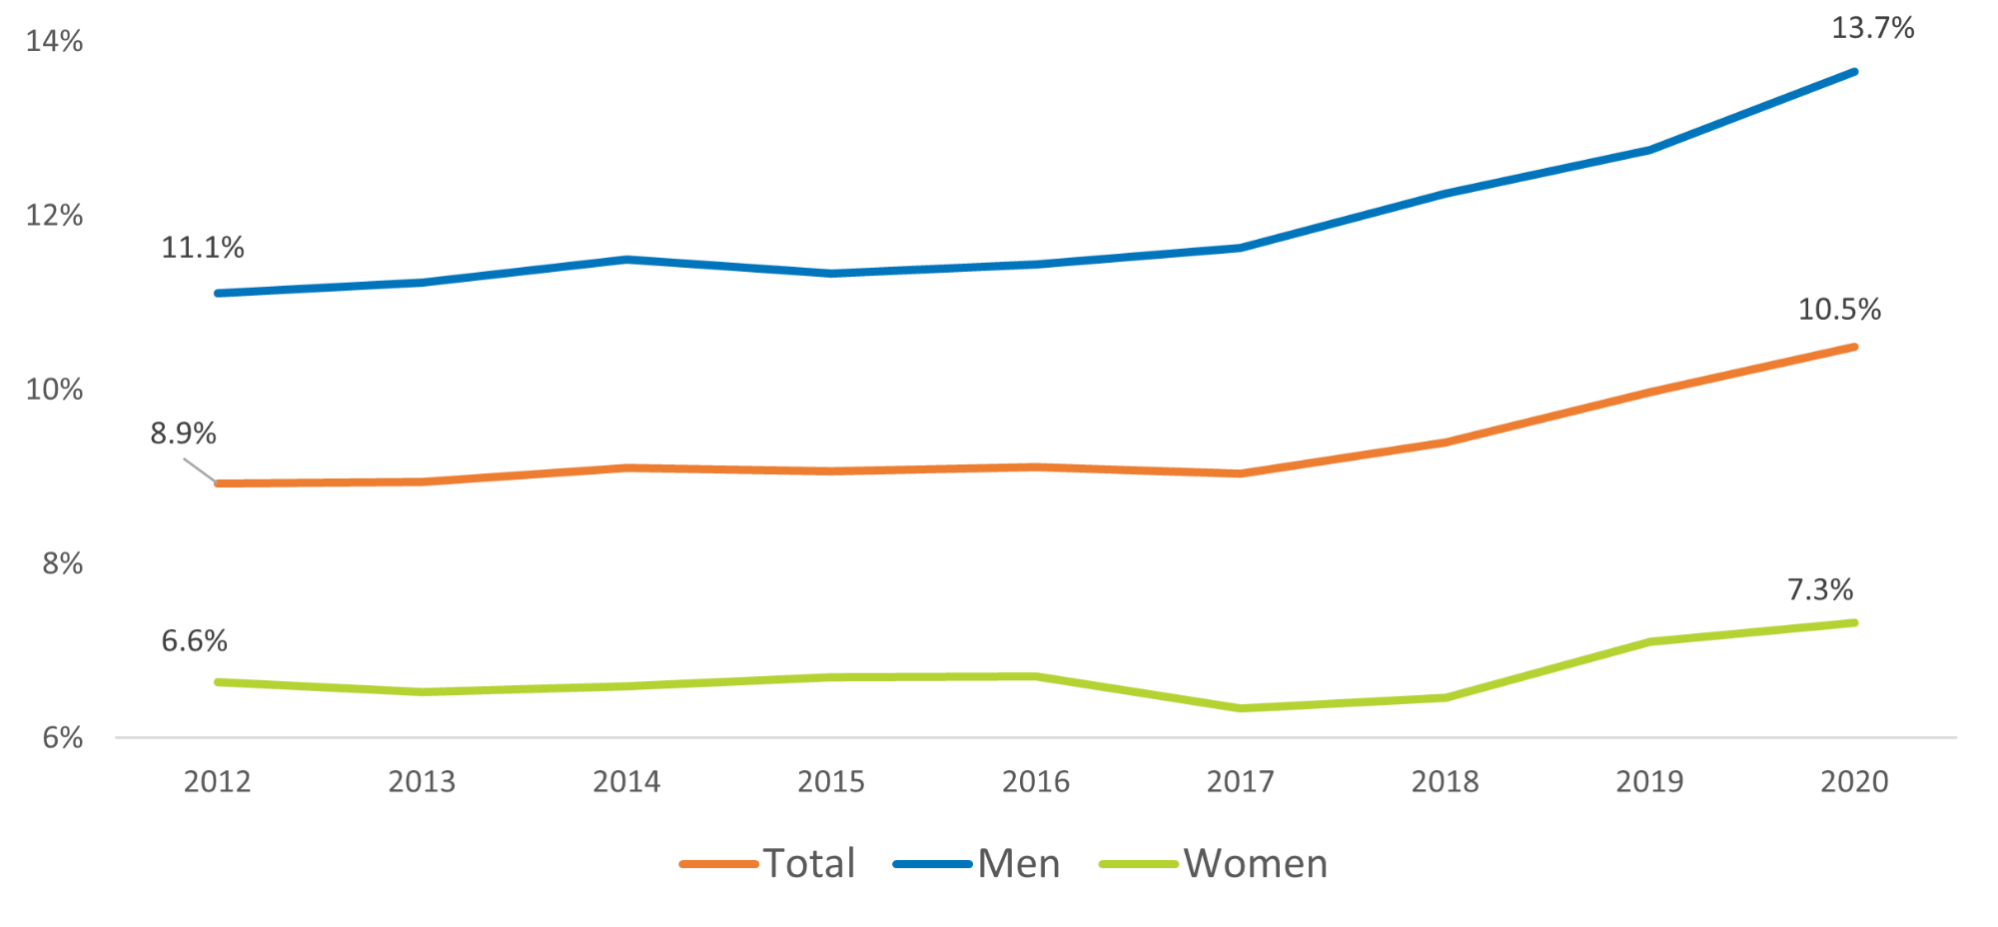
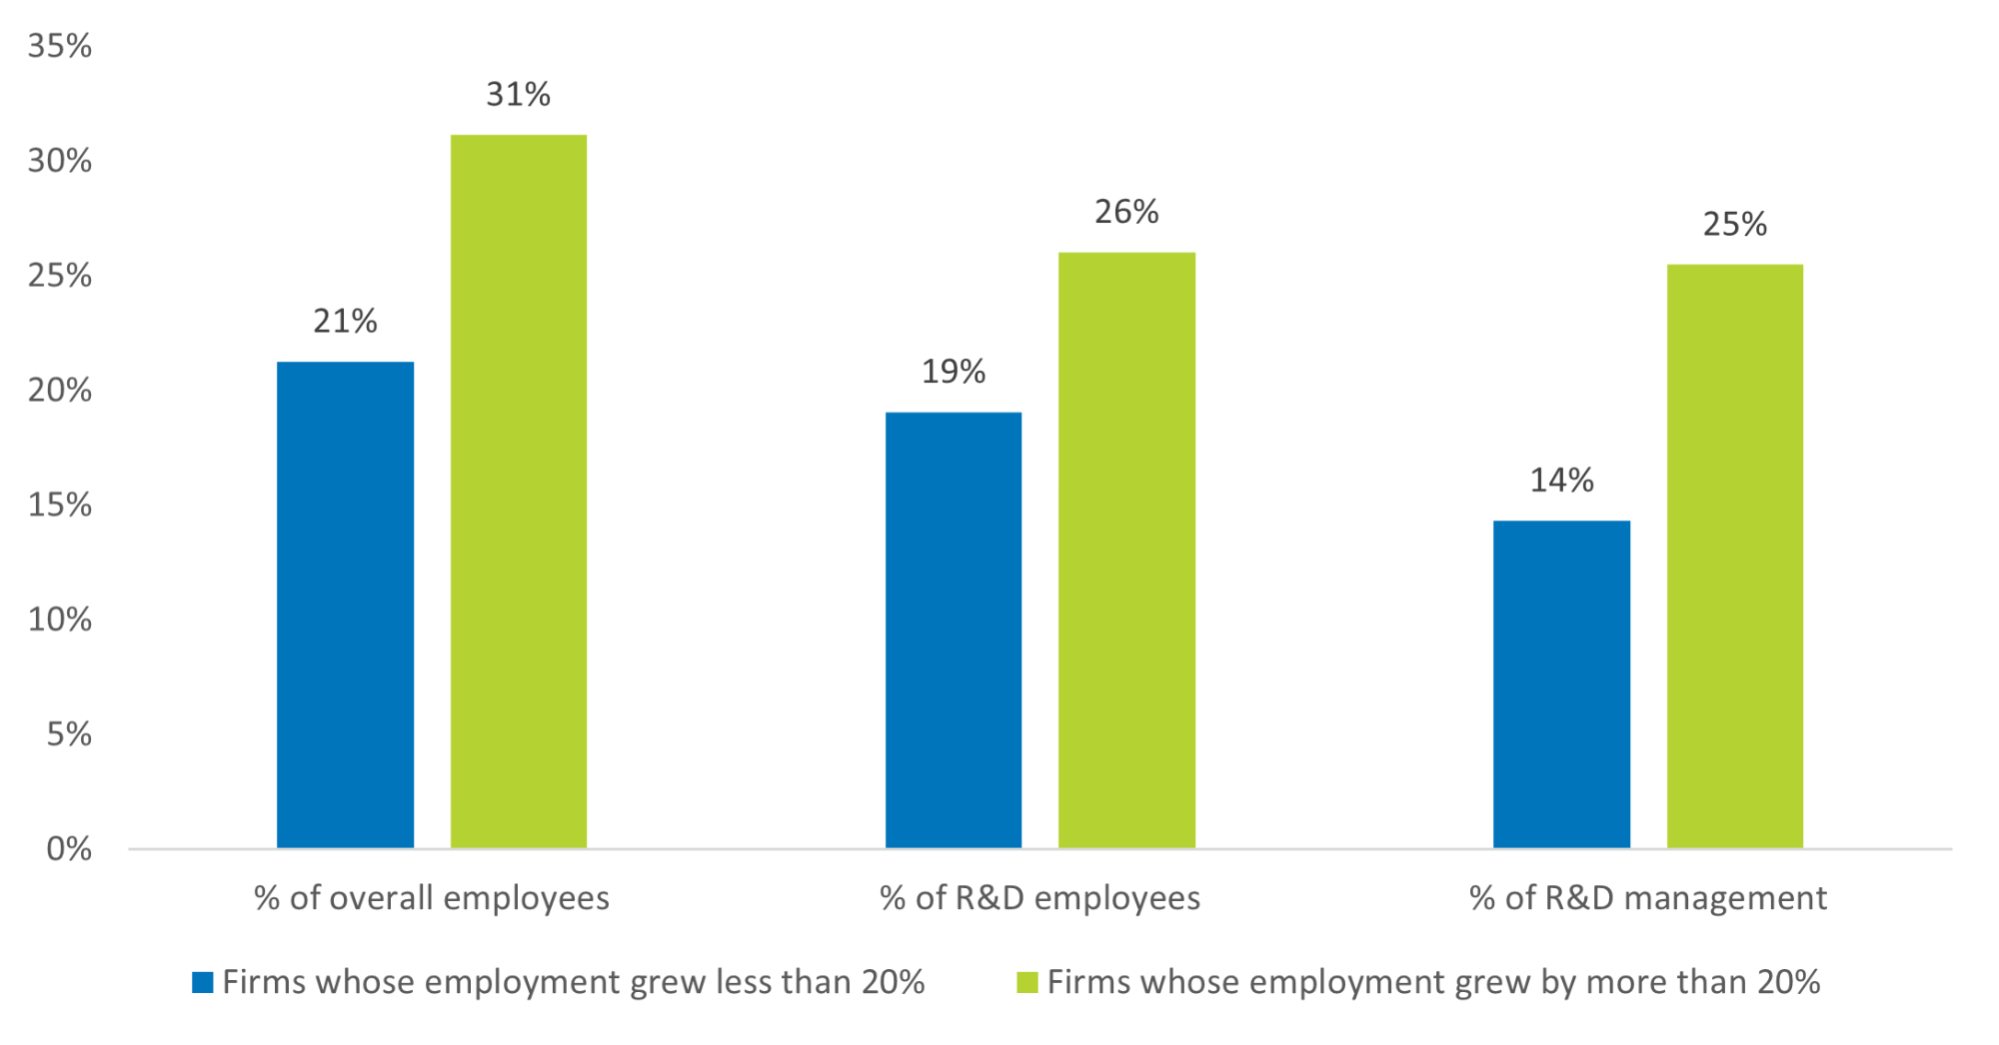
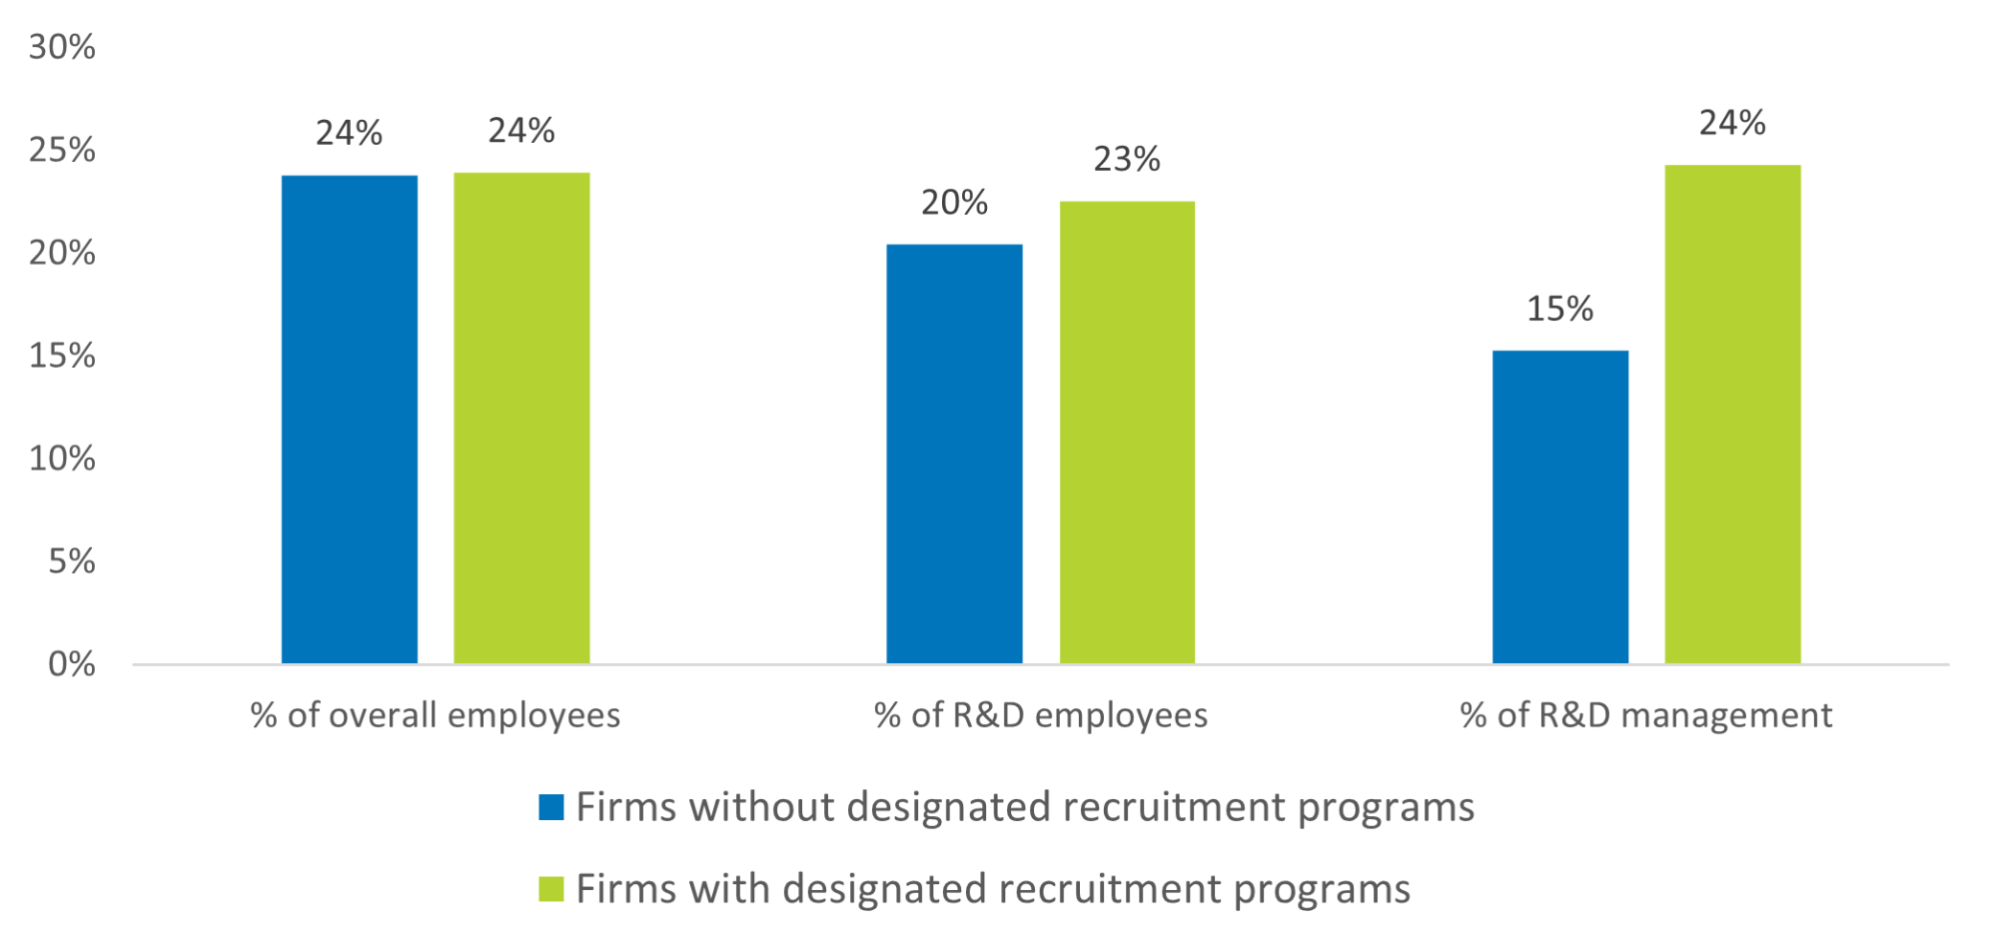
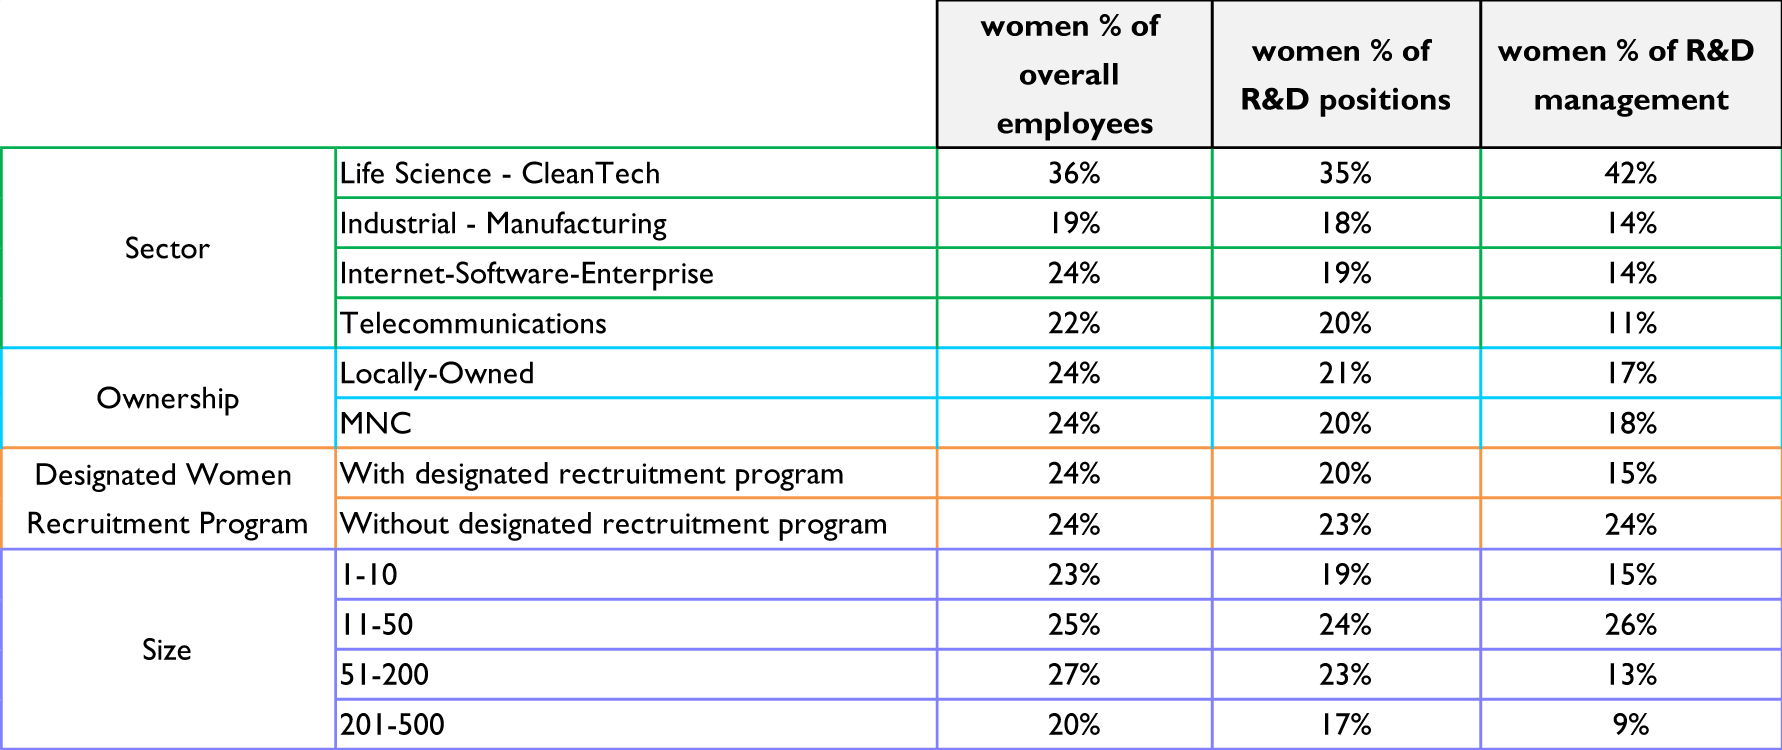
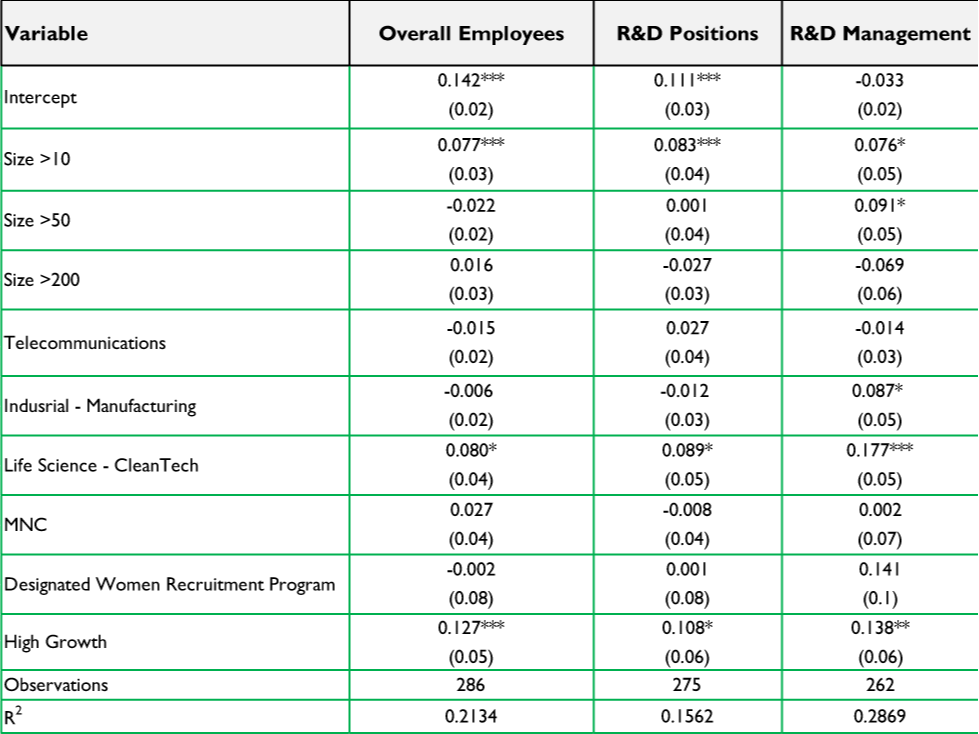
Regarding diversity in high-tech, the majority of its workforce is still overwhelmingly male. Our findings indicate that smaller companies have a lower share of female employees, while companies in the Life Sciences tend to have a higher share of female employees. Multinational corporations also tend to have a higher share of female employees in R&D management positions. Finally, the companies with the highest recruitment rates (above 20%), also tend to have higher shares of female employees.

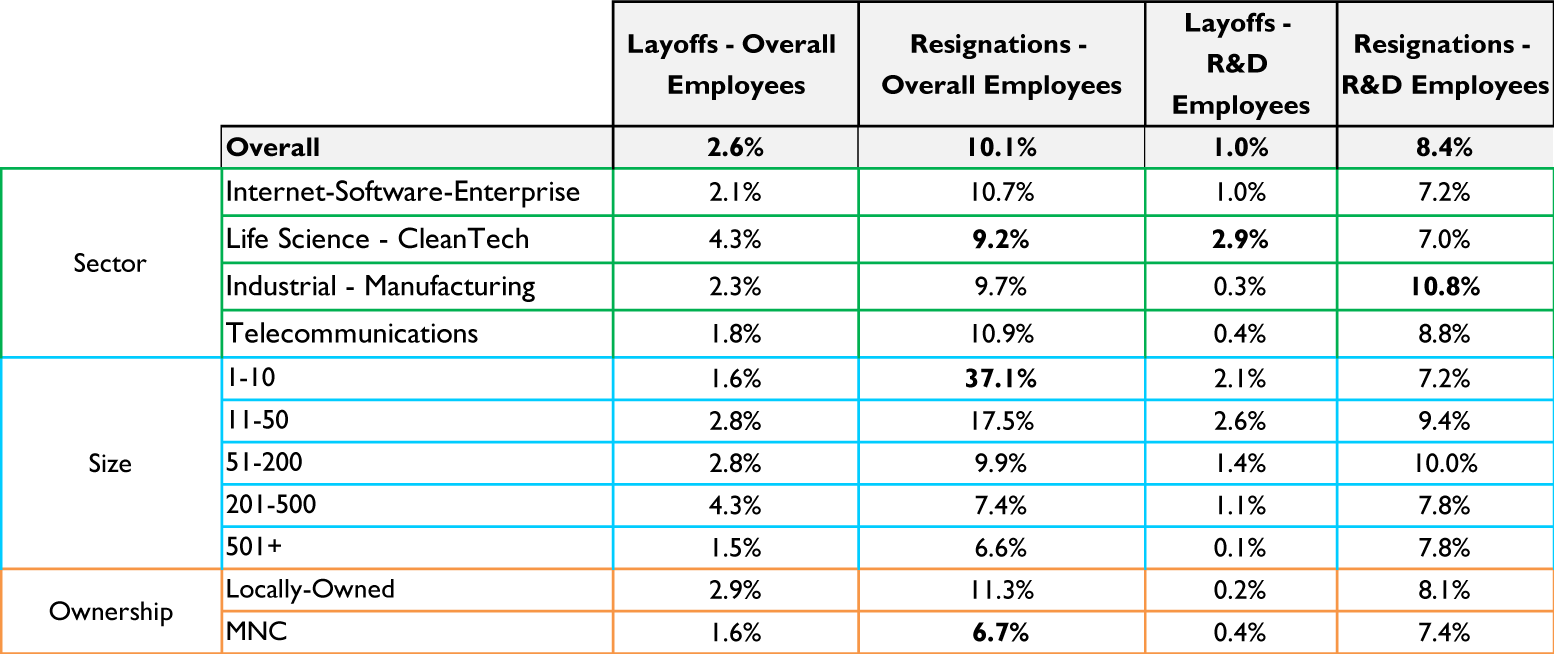
The phenomenon of an “employees’ market” is evidenced by the high rates of voluntary resignations and low rates of layoffs. In H2 2021, 10.1% of high-tech workers resigned – a figure similar to pre-COVID levels. In parallel, a sharp decline of 2.6% was measured in the rate of layoffs – the lowest level in the past decade. Voluntary resignations were most damaging to the smallest companies, especially those with less than ten employees. In H2 2021, these companies lost a third of their employees (the calculation refers to their initial status, but it should be noted that in some cases these companies recruited additional employees concurrently). Alongside this, the Life Sciences and Cleantech sectors had a significantly lower rate of resignations, at 9.2%, despite the fact that most companies in these sectors are small. Finally, the rate of voluntary resignations was significantly lower (by 7%) in companies with a higher share of female employees.

The phenomenon of employees moving between companies indicates both the high level of competitiveness within the industry, alongside the challenge of managing operations despite a transient workforce. It should also be noted that this phenomenon makes it harder for inexperienced workers to enter the industry. An oft-heard claim is that high-tech companies prefer to compete over senior (and more expensive) employees, rather than investing in juniors whose output in early stages is low, out of concern that they will move to a different company shortly after the end of the training period.

Furthermore, the economic literature indicates that in times of recession, companies typically minimize expenditures via layoffs (its easier to fire workers and hire new ones during a recession rather than lowering existing workers’ salaries). Therefore, there is a legitimate concern that should the recession intensify, we may see an increase in the rate of layoffs, mainly of juniors, non-technological workers, and workers with non-academic backgrounds.

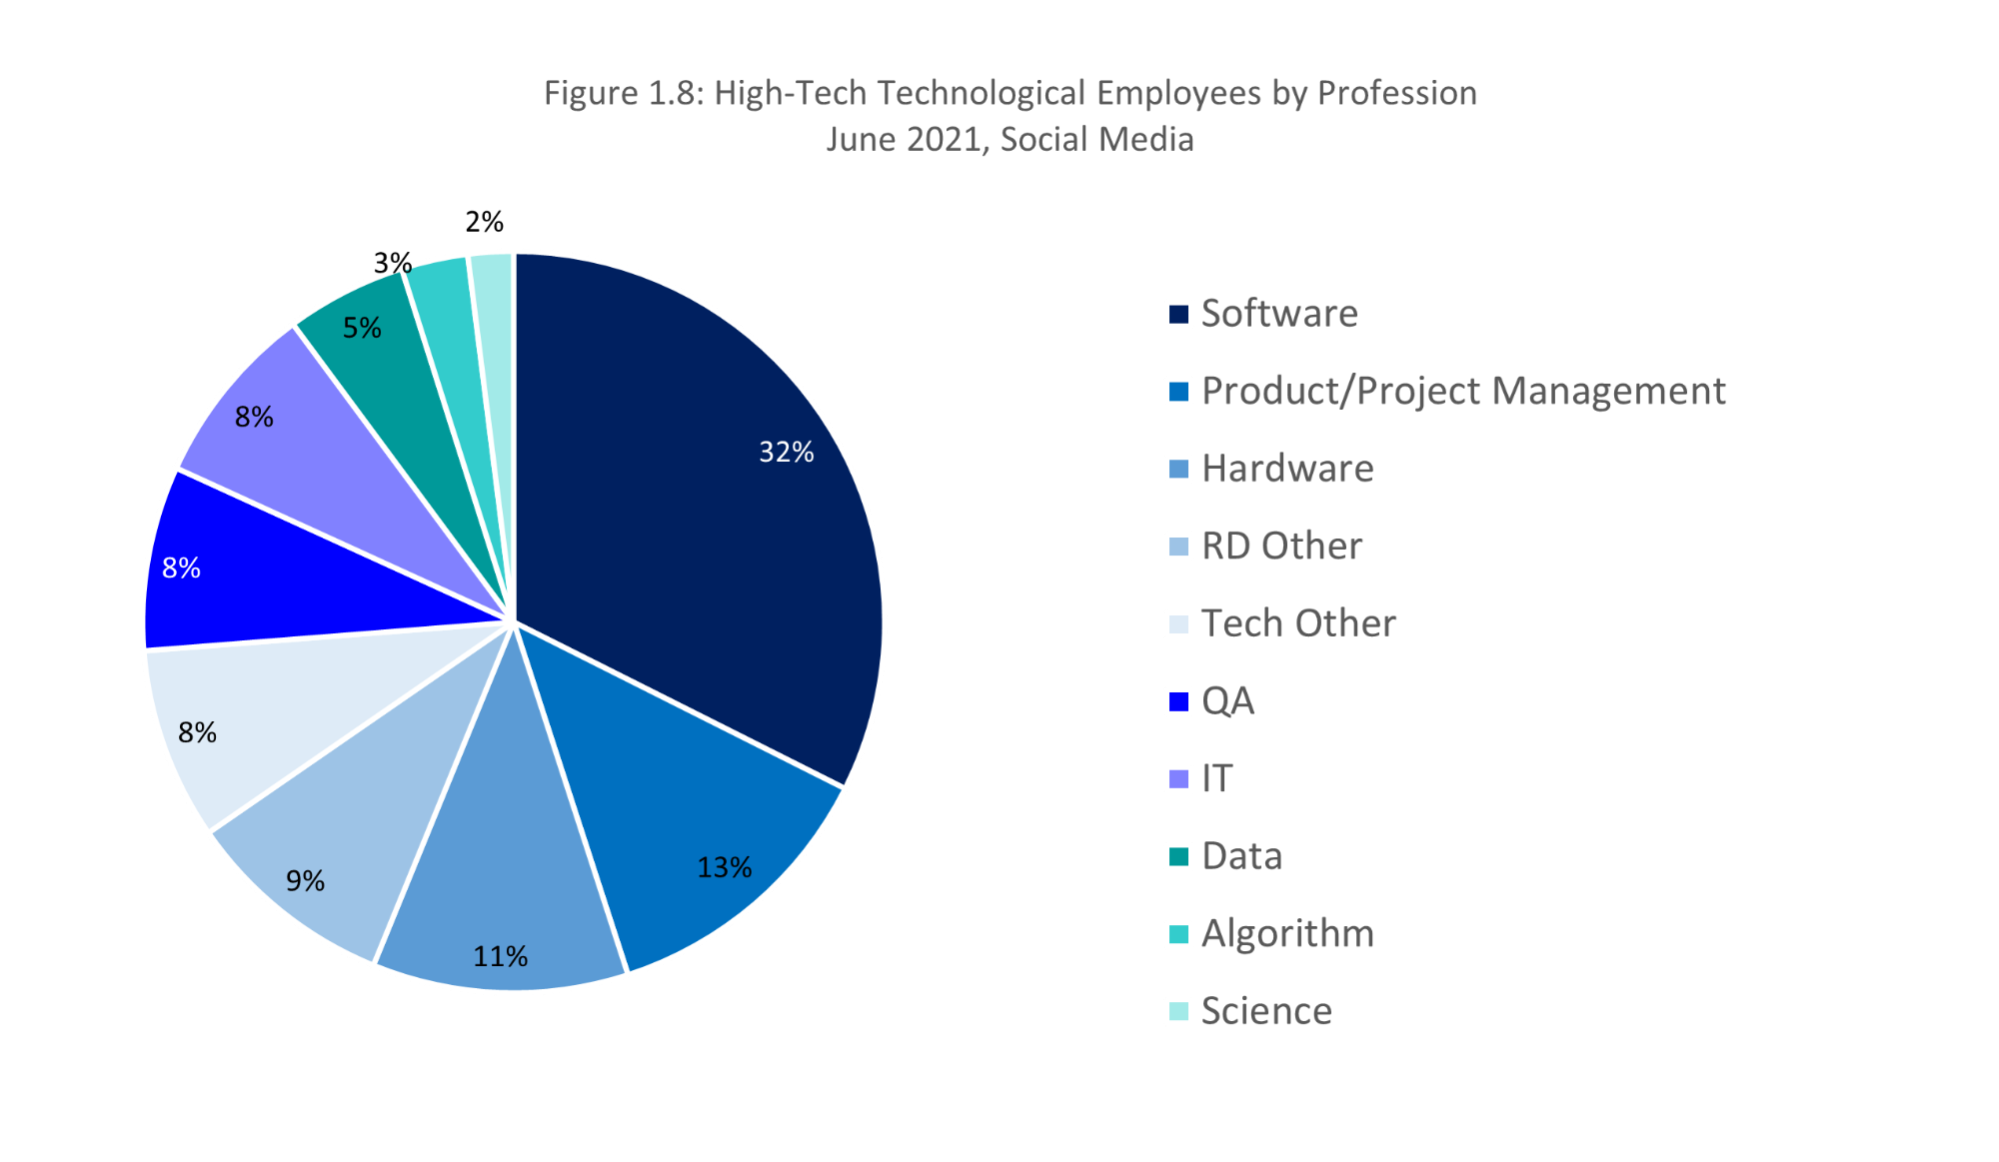
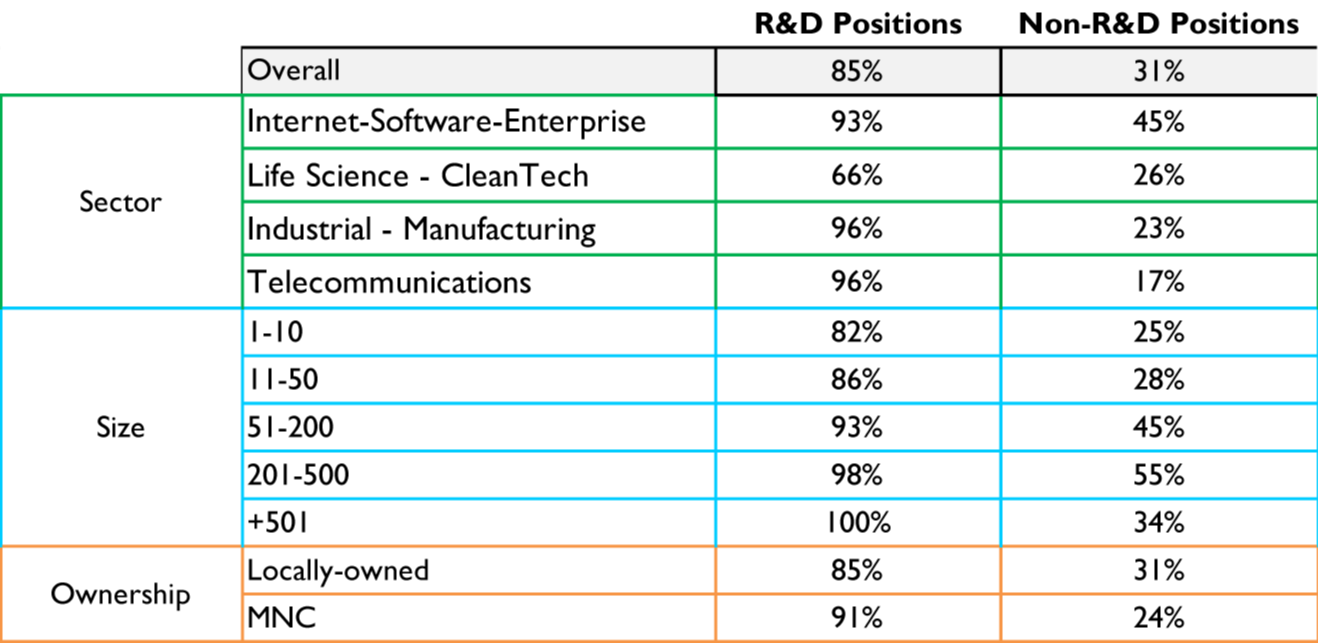
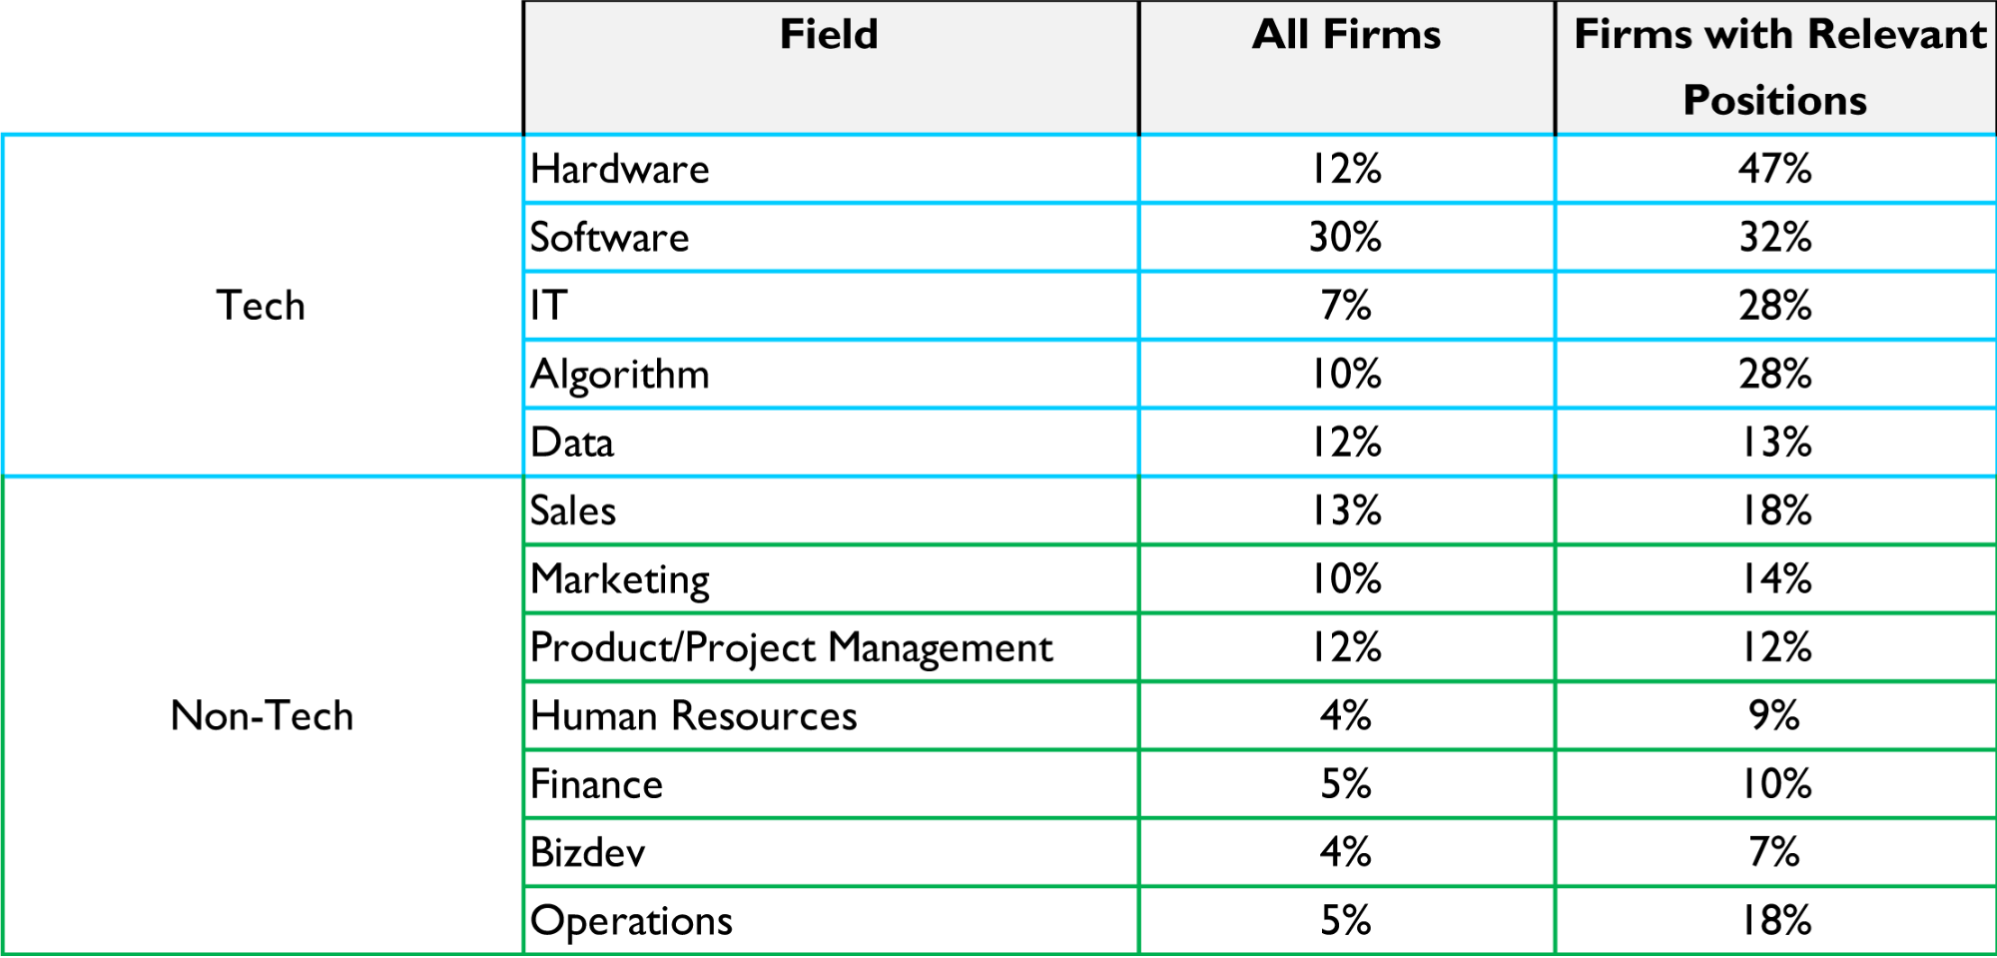
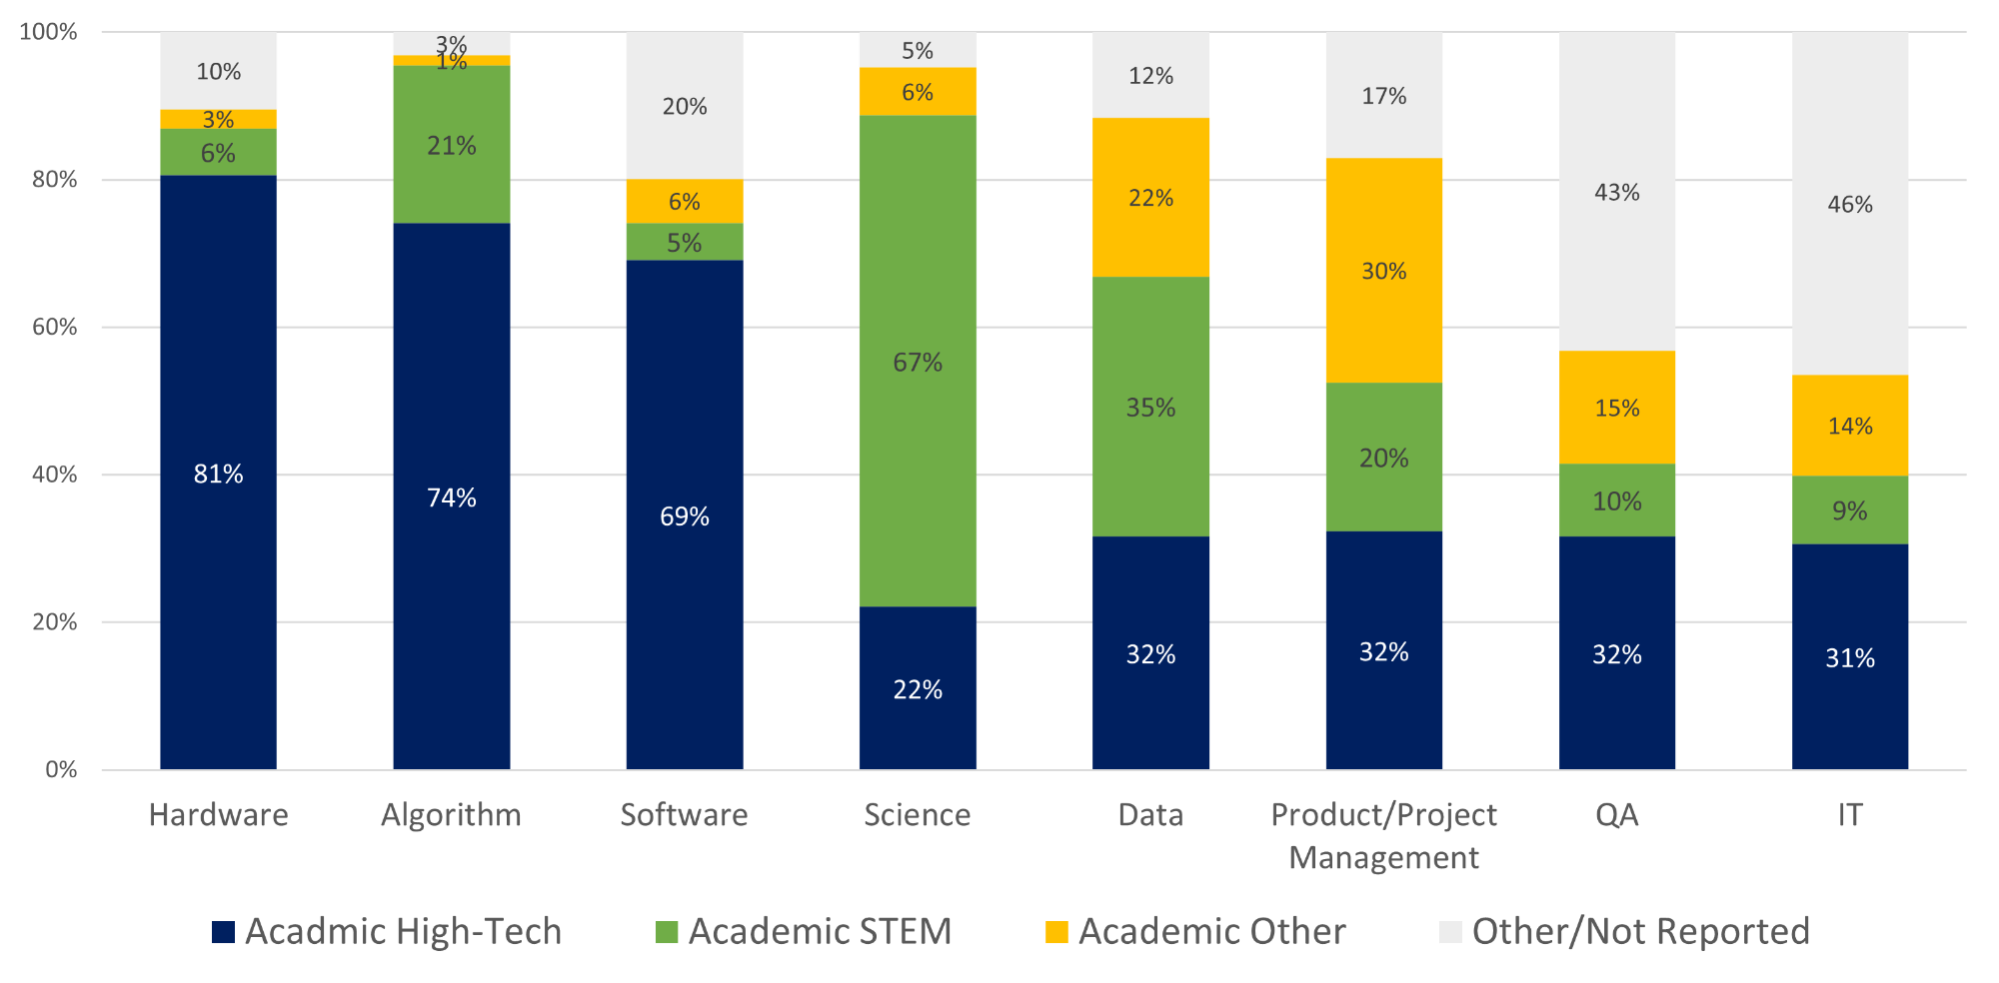
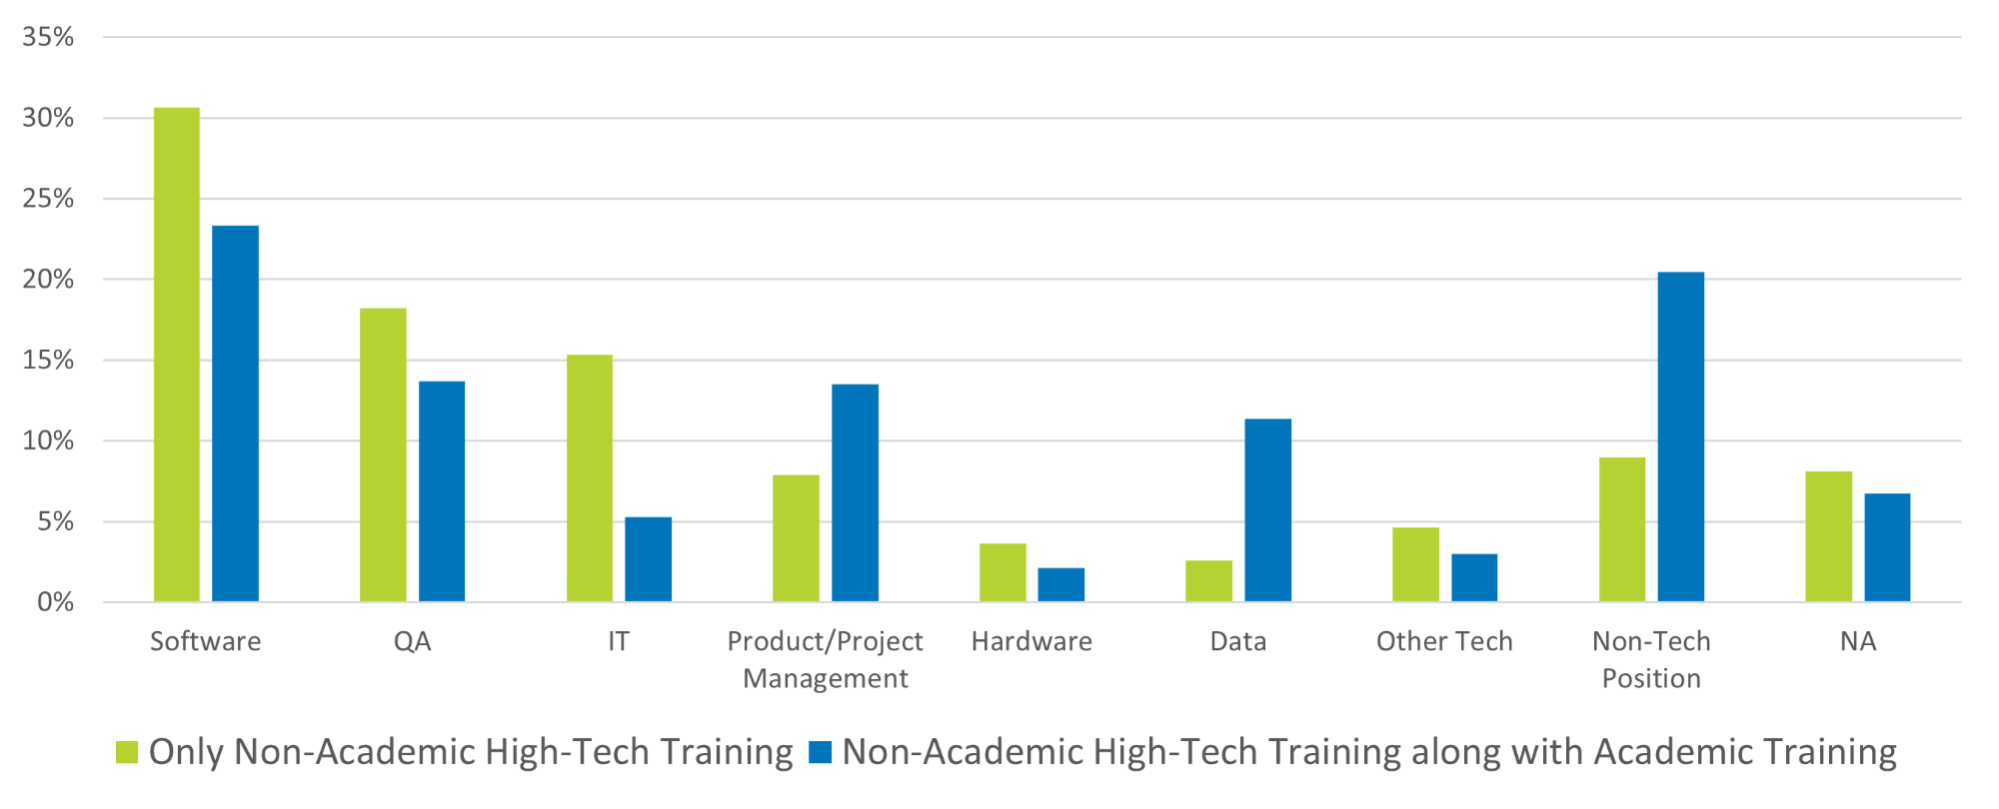
The topic of training is especially important when assessing methods for increasing the supply of human capital in the high-tech sector. This year’s report analyzes, for the first time, data on the connection between types of training and individuals’ first high-tech role. Our main finding is that academic education is still the main entry-point into high-tech. 80% of employees in their first technological role in the high-tech industry have academic degrees; the bigger the company, the higher this rate. This connection strengthens as we approach the roles at the top of the R&D pyramid (i.e., hardware and algorithms).

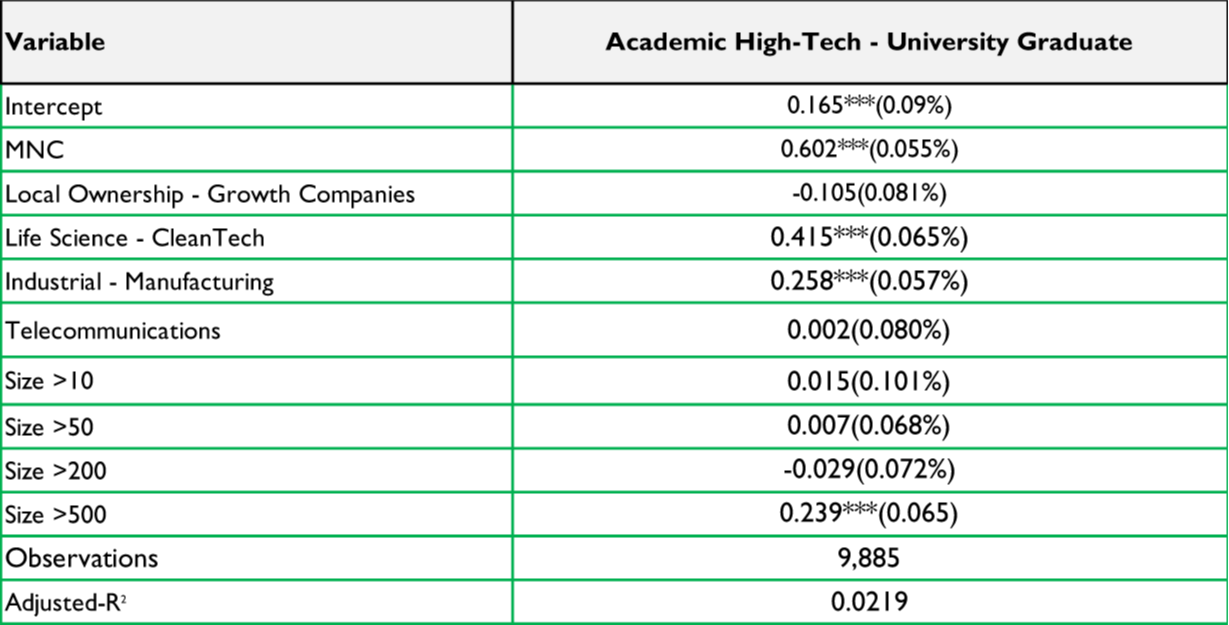
Naturally, an academic education in a high-tech profession offers an advantage for entering the high-tech industry, especially the R&D centers of multinational corporations. 68% of workers that began working for these centers hold academic degrees in high-tech fields, as opposed to 49% of workers in local companies. In addition, the dominance of universities is still evident: over 60% of new technological workers enter the high-tech industry with university degrees, versus 36% with college degrees (its important to remember that the number of high-tech graduates in recent years is similar for both types of institutions).

The report also points to the significant missed opportunity of integrating women into high-tech companies. According to the survey that was conducted for this report, along with data from social media, the rate of women in high-tech companies stood at 30% in 2021

The report also points to the significant missed opportunity of integrating women into high-tech companies. According to the survey that was conducted for this report, along with data from social media, the rate of women in high-tech companies stood at 30% in 2021. The share of women is highest in the Life Sciences and Cleantech sectors, and in companies whose recruitment rate exceeded 20% between July 2021 and January 2022.

In accordance with these figures, and particularly in light of the crisis in past years, we believe that government policy should focus on training human capital for the long-term. Attempts to respond to short-term shifts in demand – whether during market expansions or downturns – are not optimal. The government’s focus should be on “deep” trainings, both by increasing the number of university graduates in the high-tech professions, and by encouraging high-level extra-academic trainings. In addition, the focus for everyone – from government to the industry and civil society – should be on integrating underrepresented populations, specifically women, Arabs, and the ultra-Orthodox.

An additional topic that requires creative thinking both on a research and a policy level is the Life Sciences and Cleantech sectors. Although they are included – reasonably so – in all definitions of the high-tech sector, from a human capital perspective they are different from the rest of the industry that is heavily based on software and electronics. These sectors report significant less difficulty in recruiting R&D workers, and their rate of voluntary resignations is lower. They are also more likely to employ graduates with scientific backgrounds, and they tend to employ a significantly higher share of women.

Foreword:
Dror Bin, CEO, Innovation Authority

In the midst of economic turmoil, with inflation and interest rates rising worldwide, along with a diminished appetite for risk on the part of investors and private equity, the war in Eastern Europe and the many shocks convulsing both the global and Israeli economies -- the current state of Israeli high-tech, which broke records in 2021 in terms of fundraising and employee recruitment, seems to reflect a different reality. Although the Human Capital Report reflects a survey conducted last year , we should not disregard the insights and changes from 2021 as we face the challenges awaiting the Israeli high-tech industry in the immediate and long-term future.

The COVID-19 pandemic, which many have already relegated to the past, propelled both the Israeli and the global markets toward a digital transformation in every aspect of our lives; from retail and services, to education and employment. This digital transformation has created a severe shortage of technological manpower, but at the same time, it has also catalyzed growth professions supplementing these jobs. This is clearly indicated by the data: the number of open technological positions is currently 21,000 (compared to 18,500 in pre-COVID 2019), and 12,000 non-technological vacancies (compared to under 5,000 in 2019).

Read more 🔽

Close🔼

Foreword:
Uri Gabai, CEO, Start-Up Nation Policy Institute

This report, a collaboration between the Israel Innovation Authority and Start-Up Nation Central, is now in its fourth consecutive year, and conducted by the Start-Up Nation Policy Institute (SNPI) for the first time. Its goal is to highlight trends in Israeli high-tech’s demand for human capital, with the understanding that this issue is the industry’s primary challenge within Israel.

The rapidly changing reality in the high-tech sector poses a challenge to us as researchers, as the report presents a snapshot of a given period. As an annual report, it reflects the period of 2021 and the first half of 2022 – historically one of the strongest periods for Israeli high-tech. Investments in Israeli high-tech companies in 2021 broke records, with approximately $27B invested in venture capital, further fueling the demand for skilled employees. This report’s findings indeed demonstrate a near-12% increase in the total number of high-tech employees, led by Israeli growth companies. On the flip side is the exacerbation of the “employee’s market” phenomenon – 2021 showed a return to “pre-COVID” numbers – with the highest rate of voluntary resignations in high-tech and the lowest percentage of layoffs (10.1% and 2.6%, respectively).

Read more 🔽

Close 🔼

Methodology 🔽

Methodology 🔼

There are several definitions for companies included in Israel’s high-tech industry. Accordingly, in every report dealing with this specific sector, it is necessary to decide what the relevant definitions should be. In this report, the population of high-tech companies is defined as those companies appearing in the Start-Up Nation Central (SNC) Finder database, which differs from the population of companies defined by the Central Bureau of Statistics as “high-tech” companies.

The report is based on three sources of information:

  • The Central Bureau of Statistics (CBS) provided data on the total number of employees at companies appearing in the SNC Finder database, together with a breakdown according to sector, company size, and ownership type (local/foreign). This data constitutes the basis for our assessment of the size of the high-tech companies’ population and its workforce and enables weighting of the survey data for entire population estimates.

  • As in every year, we conducted a survey of companies within the Finder database sample. The survey was conducted in Q2 2022 by Ethosia and 354 companies replied to it. The survey includes stratification according to sector, company size, and ownership type, in order to obtain a sufficiently diverse sample. Table 1 illustrates the characteristics of the sample population.

  • This year, for the first time, we used data collected from social media on the education and employment history of a substantial sample of more than 100,000 high-tech employees. It is important to note that we only utilize data from the public domain that is anonymized and used for aggregate statistical analyses only.

Table 1: Survey and Social Media Sample Representation by Sector, Size and Ownership

Chapter 1: Growth in the number of high-tech employees in 2021

  • keyboard_double_arrow_right

    High-tech employment grew by 12% in 2021, totalling approximately 30,000 employees.

  • keyboard_double_arrow_right

    Local firms recorded the highest growth (14%), while multinational corporations grew by only 5%.

  • keyboard_double_arrow_right

    Within local firms, the most significant growth (30%) was recorded among “growth” companies (unicorns, firms that went public in the past decade, and firms that are part of the “Growth Companies Forum”).

Israeli high-tech had one of its most successful years in 2021. Venture capital investment reached $27B and dozens of companies went public or achieved unicorn status. This success was also reflected in hiring practices: after a mild increase of less than 1% in 2020, largely due to the COVID-19 crisis, high-tech employment in 2021 grew by 12%, representing an increase of 29,900 employees. Although this outpaced the 8% average annual growth rate over the past decade, it should be kept in mind that this rate partly reflects a “correction” for the pandemic year, with the return of staff that were placed on unpaid leave. A quarterly analysis (Figure 1.1) shows that Israeli high-tech grew consistently over the past year.


Figure 1.1: Employment Growth in 2021
Source: CBS, QoQ

Multinational R&D centers accounted for the main growth in number of employees in 2020 (3%), whereas domestic firms reported zero growth in number of employees. In 2021, however, the trend reversed: while multinational R&D centers experienced a high employment growth of 5%, domestic firms reported a 14% increase in employment (Figure 1.2).

Furthermore, Israeli firms’ share of employment grew from 74.6% at the end of 2019 to 76.5% at the end of 2021. The data demonstrate the financial backing allowing multinational R&D centers to weather hard times, while also indicating the growth potential of domestic companies that are more sensitive to market fluctuations. Domestic companies, particularly those in advanced growth stages, do not only increase the number of technological employees during “good times”, but also the number of non-technological employees – marketing, product, sales, legal and more. Indeed, a mid-2021 employment analysis indicates that technology employees make up for more than 80% of multinational R&D centers’ workforce, compared to only about 65% among domestic firms.


Figure 1.2: Employment Growth in 2021 by Company Ownership
Source: CBS, QoQ

Growth Among Israeli Firms

A particularly high increase of 30% was recorded among “growth” companies, defined as those that meet at least one of the following criteria: (1) private ownership and a valuation of $1 billion or more (“unicorns”), (2) IPO in the past decade, or (3) membership in the Growth Companies Forum. Small startups (up to fifty employees) also showed significant growth—some of which, however, is attributable to the small-numbers effect.


Figure 1.3: Employment Growth in 2021 in Domestically Owned Companies
Source: CBS, QoQ

Growth by Sector

Israeli high-tech employees work in a variety of technological sectors (Figure 1.4, sector categorization according to Start-Up Nation Finder), in a relatively equal distribution. A sector whose relative share has been small over the years is Mobile and Telecommunications technologies, which currently accounts for 6% of high-tech employment. On the other end of the spectrum is the Industrial sector, which consists of large firms that comprise a fifth of high-tech’s employment.


Figure 1.4: Israeli High-Tech by Subsector
CBS, Q4, ~300K employees

Over the course of 2021, the high-tech sector experienced positive growth in all sectors (in contrast to 2020, when hardware-based sectors scarcely grew, and staff in telecom and manufacturing even contracted). Concurrent with rapid increases in staff in software-oriented sectors, the AgriFood-tech and CleanTech sectors also stood out favorably, ostensibly a reflection of the rise in investments in the alternative proteins market. Indeed, according to data from Start-Up Nation Finder, equity investments in this sector amounted to $527 million in 2021, outpacing investment in the entire AgriFood-tech sector in 2020 by a factor of more than 1.5.


Figure 1.5: Employment Growth in 2021 by Subsector
Source: CBS

A comparison between annual growth in equity investments and annual growth in employment indicates a positive correlation within hiring and investments in a sector (Figure 1.6). An exception to this correlation is the Advertising and Social Media sector, which showcases a relatively small increase in investments despite a very high increase in number of employees. One explanation could be that this sector is characterized by a relatively large number of growth companies, that have surpassed the equity investments phase, and are simultaneously rapidly growing in number of employees, particularly non-technological ones.


High-Tech’s Employment Composition by Profession

Figure 1.6: Employment Growth vs. Growth in Equity Investments by Subsector
Source: CBS and SNC Finder

...... Software-based ...... Hardware-based

Based on an analysis conducted on a large sample of Israeli high-tech employees, we first introduce a segmentation by role. It should be noted that any segmentation, which consists of thousands of profession definitions (some of which include esoteric names that do not reveal much about the nature of the role), contains a certain degree of arbitrariness. Nevertheless, we find there is value in a higher-resolution segmentation than the standard tech to non-tech comparison.
Figure 1.7 data indicate that approximately 70% of high-tech employees work in technological positions, one third of which are software employees (Figure 1.8).

Chapter 2:
Employee recruitment and open positions

  • keyboard_double_arrow_right

    A record 32,900 open positions in Israeli high-tech were estimated in April 2022.

  • keyboard_double_arrow_right

    The main increase in open positions was recorded among non-technological positions, which more than doubled in comparison to past years.

  • keyboard_double_arrow_right

    As in previous years, 84% of the companies reported recruiting employees between July and December 2021. Almost all (85%) reported difficulties in recruiting R&D employees, a 20% increase in comparison to last year.

Scope of Recruitments

In line with the data presented in the previous chapter, 2021 was a record year in Israeli high-tech in terms of human capital recruitment. The vast majority of surveyed firms (84%) reported having recruited throughout the second half of 2021, with the overall number of recruitments in that half estimated at 34,000 employees, 25,000 of which were recruited for R&D positions. However, data from the Central Bureau of Statistics indicate that only 16,500 employees joined throughout the same period, that is - about half of the recruitments were of employees that moved between firms within the industry, and the rest were new industry entrants (either from other industries or as new entrants to the labor force).

The vast majority of recruitments (78%) were for R&D positions, a rate reflecting the high mobility of workers between firms. Naturally, this rate decreases as the firm’s size increases: from 87% R&D recruitment among the smallest firms (1-10 employees) to 60%-65% among midsize-to-large firms (above 50 employees).

The survey data show that juniors accounted for approximately 11,000 employees that were recruited for R&D positions throughout H2 2021, or 20% of R&D recruitments. While this rate is lower than the one recorded last year, it should be emphasized that it is likely the result of the relatively high rate of experienced employees moving from one high-tech company to another, and not a decline in the absolute number of juniors that entered the industry.

In the analysis by company size, one can see that the rate of junior recruitment is higher among both the smallest firms (up to 10 employees) and the largest ones. It is reasonable to assume that larger firms have an easier time recruiting juniors due to extensive managerial resources needed to train new employees, while small firms, whose resources are limited, are more likely to be forced to recruit juniors out of inability to compete over more experienced engineers. A similar phenomenon was noted last year as well.


Table 2.1: Average Number of Recruitments in H2-21', Share of R&D and Junior R&D Positions

In terms of recruitment, the Life Sciences and Cleantech sectors stand out in several ways: fewer firms in this sector recruited employees (72%); the R&D share of recruitments is lower (an 11% - decrease in a linear regression); and they employ a higher rate of juniors (about 32 percentage points in a linear regression). These differences likely stem from the fact that these sectors have a different mix of employment in comparison to the rest of the high-tech industry. In particular, they are characterized by a higher share of R&D employees with scientific, non tech backgrounds (such as life and natural sciences). Throughout the report we will showcase that the resignation rate among this sector is lower as well. That is, the uniqueness of these sectors’ human capital results in lower employee turnover, which explains the lower rates of resignation and recruitment of R&D employees. Moreover, a significant share of employees in these sectors hold advanced scientific degrees and are thus recruited despite lacking experience in the industry.


Open Positions and Recruiting Challenges


Table 2.2: Estimated Number of Open Positions, in thousands

Open positions in 2021 reached record numbers as well. Survey data indicate that there were 32,900 open positions in April 2022, out of which about 21,000 were for technological positions and an additional 11,800 were for non-technological positions. The number of open positions not only grew in comparison to the pandemic year, but also in comparison to July 2019 (Table 2.2). It should be noted that the survey was conducted after the outbreak of the war in Ukraine, the supply chain crisis in China, and the beginning of the decline in the valuation of Israeli companies traded on Wall Street, such that the figure takes into account companies’ perception of changing market conditions in the first half of 2022.

About a third of open positions were in the field of software, accounting for nearly 10,000 open positions in April 2022. This is also the field that had the most difficulty in recruiting, noted by 30% of the firms.


Figure 2.3: Estimated Number of Open Tech Positions
April 2022, 21K positions, survey results weighted by high-tech population

Among non-technological fields, the highest number of open positions was recorded among sales, product and project management (about 3,000 open positions in each), followed by marketing (about 2,000 open positions).


Figure 2.4: Estimated Number of Open Non-Tech Positions
April 2022, 11.8K positions, survey results weighted by high-tech population

Firms were also asked about difficulties in recruiting employees. About 85% reported difficulties in recruiting R&D employees.

Difficulties in recruiting were reported among non-technological fields as well, yet at much lower rates (31%). It should be noted that this was correlated with company size; among companies of 200 employees or more, the share of firms that reported difficulties in recruiting non-technological employees reached 55%.


Table 2.5: Share of Companies that Reported Difficulties in Recruiting Employees by Field

The table below presents the share of firms reporting difficulties in recruiting employees in each position, with one column representing the position’s share within all firms, and the second column listing the share of firms with relevant open positions in each field. That is, the first column measures the overall difficulty in recruiting employees in that field, and the second one measures the difficulty of firms likely to look for employees in this field.


Table 2.6: Share of Companies that Reported Difficulties in Recruiting Employees by Field

The field that firms indicated was the hardest to recruit for (30%) was software, yet this figure mainly reflects the fact that it is the field with the highest demand for employees. Fewer firms reported difficulties in recruiting hardware employees, yet among “relevant” firms (with open positions in the field), this rate rose to 47%.

Among non-technological positions, we see similar rates of difficulty in recruiting in the fields of sales, marketing and product (10%-13%), once again, corresponding with the rate of open positions in these professions.

Statistical Appendix 🔽
Table 2.7: Estimated Number of Open Positions
April 2022, Survey Results Weighted by High-Tech Population

Statistical Appendix 🔼
Table 2.7: Estimated Number of Open Positions
April 2022, Survey Results Weighted by High-Tech Population

Chapter 3:
Resignations and layoffs

  • keyboard_double_arrow_right

    In 2021, there was a return to pre-COVID levels in the rate of voluntary resignations, reaching 10.1% in H2.

  • keyboard_double_arrow_right

    A concomitant sharp decline was recorded in the rate of layoffs, to a level of 2.6% – the lowest in the last decade.

  • keyboard_double_arrow_right

    The percentage of resignations was greater the smaller the company, and this was especially damaging to small companies of 10 or fewer workers, with a 37% rate of voluntary resignations (in relation to the number of workers at the beginning of the second half of 2021; see footnote).

  • keyboard_double_arrow_right

    The Life Sciences and Cleantech sectors showed a significantly lower rate of voluntary resignation, amounting to 9.2%, even though most of the companies in these sectors are small.

  • keyboard_double_arrow_right

    The rate of voluntary resignation was significantly lower (by 7 percentage points) in companies employing a high proportion of women.

Two trends had an impact on the percentage of voluntary resignation among high-tech workers. The first one – "the great resignation” – intensified due to the COVID-19 pandemic and peaked in 2021. This is a global phenomenon affecting the entire Israeli economy, and particularly the high-tech industry. At the same time, the demand for workers with relevant skillsets for high-tech continues to grow faster than the available supply, with a consequently higher frequency of worker migration from one high-tech company to another than in the past. There are a variety of reasons for this, which include a desire to improve employment terms, a shift to companies enabling remote work, or a preference for companies whose mission workers identify with more strongly, in parallel to the understanding that for now, employees can readily find other jobs.


Figure 3.1: High-Tech Turnover - Voluntary Resignations vs. Layoff Rates
Source: Human Capital Survey - Ethosia (2021), Zviran (2009-2020

While it is difficult to isolate the impact of each of these phenomena, their combination has led to a situation where in 2021, the rate of voluntary resignation returned to the levels measured in 2018 and 2019, when 10.1% of the high-tech employees elected to voluntarily leave their place of work (Figure 3.1). A closer look at the chart shows that this is not a one-time phenomenon but a continuing long-term trend of an increasing rate of voluntary resignations over the years, that was temporarily interrupted in 2020. It is also important to point out that this phenomenon is not unique to R&D workers, and in practice the rate of voluntary resignation among these workers was lower than the overall rate, amounting to only 8.4%. On the other hand, the rate of R&D worker layoffs also was significantly lower than that of the overall workers, amounting to 1%.

The percentage of voluntary resignations was higher the smaller the company size (naturally, this is partially due to the “law of small numbers”). In companies with up to 10 employees, an exceptionally high average resignation rate of 37% was recorded. Company size does not significantly affect the rate of voluntary resignation among R&D workers, however. A possible explanation for this is that small companies with limited resources might tend to invest more in retaining their R&D workers, while relinquishing other non-tech workers.


Table 3.2: Average share of resignations, by company size

In order to isolate the influence of various factors (sector, company size, ownership type) on the rate of layoffs, we conducted a linear regression (see annex). We found a strong and significant effect of company size, as described above.

We found no differences in the rate of voluntary resignation among the various sectors, apart from the Life Sciences and Cleantech sectors, in which the rate of voluntary resignation was significantly lower, amounting to 9.2%. The regression analysis shows that this difference is greater than it appears, as in this sector the companies are smaller in size on average than in the other industry sectors; therefore, we should expect a higher rate of voluntary resignations. One possible explanation for this phenomenon is that these sectors employ workers with more varied scientific training (see Chapter 4 on the distinction between “high-tech professions” and other STEM professions), and these employees have fewer alternatives. Alternatively, it is possible that the nature of the projects in these sectors generate a higher degree of employee commitment.

An interesting finding arising from this statistical analysis is that in those companies employing a higher proportion of women, the rate of voluntary resignation is significantly lower (6.9 percentage points less). A potential reason for this is that women are less likely to leave workplaces, but it is also possible that women tend to work at companies with specific characteristics that reduce the tendency to resign, even among the men working there.

Statistical Annex 🔽
Table 3.3: Layoffs and Resignations Rates by Company Type

Statistical Annex 🔼
Table 3.3: Layoffs and Resignations Rates by Company Type

Statistical Annex 🔽
Table 3.4: Regression Analysis on Resignation Rates of Overall and R&D Employees

Statistical Annex 🔼
Table 3.4: Regression Analysis on Resignation Rates of Overall and R&D Employees

Chapter 4:
Education and training for new technological workers in high-tech

  • keyboard_double_arrow_right

    Of employees in their first technological position in the high-tech industry, 80% have academic training.

  • keyboard_double_arrow_right

    The percentage of workers with an academic education tends to increase along with company size.

  • keyboard_double_arrow_right

    The R&D centers of multinational firms employ a greater percentage of employees with academic training in the high-tech professions: 68% compared with 49% in Israeli-owned companies.

  • keyboard_double_arrow_right

    More than 60% of the new technological workers enter the high-tech industry with a university education, compared with only 36% who studied at a college.

  • keyboard_double_arrow_right

    New employees in the hardware and algorithms professions are significantly more likely to have an academic education.

A deeper understanding of the training required for a technological position in the high-tech industry is the key to increasing the number of workers in this industry. Accordingly, we analyzed the education of tech employees upon assuming their first position in high-tech, based on a large sample of high-tech workers who reported their workplace and education on social media.


What and where should one study to be hired for a technological position in a high-tech company?

The academic world is still the main entry channel into technological positions in high-tech. Close to 80% (Figure 4.1) of employees in their first high-tech job have academic training. Moreover, 70% of employees in their first technological position in a high-tech company have a degree in high-tech or STEM professions. In general, we divide academic trainings into three categories: high-tech education (e.g., Computer Science, Electrical Engineering, Biotechnology), STEM professions excluding high-tech (e.g., Chemistry, Biology and Industrial Engineering), and all other subjects.

Models of extra-academic training (programming workshops and professional training courses such as practical engineering diplomas) have gained considerable momentum in recent years, and they comprise an additional entry channel into high-tech. Nevertheless, they are still relatively small in scope. Some 13% of the workers entered the world of high-tech with extra-academic training in the high-tech professions: 9% reported that this was the only form of training they had undergone, while an additional 4% had undergone such training in addition to their academic studies.


Figure 4.1: Tech Employees Training for First Position in High-Tech
(employees who began their role in 2018 or later)

Source: Social Media Analysis

The larger the company size, the greater the proportion of employees with an academic background in high-tech professions, and the smaller the proportion of employees with non-academic high-tech training (see Figure 4.2). The “leap forward” tends to occur mainly in large companies employing more than 200 workers.


Figure 4.2: Type of High-Tech Training for First Position in High-Tech by Company Size
Source: Social Media Analysis

Similarly, the R&D centers of multinational firms employ a greater percentage of employees with academic training in the high-tech professions: 68%, compared with 49% in Israeli-owned companies. It appears that these companies are much more attractive to those with academic high-tech training, or they are better equipped to successfully attract these employees. However, it is difficult to isolate the effect of this variable from other variables, such as the tendency of local companies to be smaller and the existence of more local Life Sciences companies, which by nature tend to employ more graduates with STEM training (about 30%) and fewer individuals with high-tech training.


Universities vs. Colleges

Given the importance of an academic education as a key gateway into the world of high-tech, the question of a university education compared to a college education assumes even greater significance. The data reveals that there are marked differences between the two types of institutions and their impact on graduates’ entry to high-tech. Although the number of graduates with a high-tech degree from both universities and colleges is similar, more than 60% of new tech workers have university educations, compared to only 36% of those joining from colleges. This statistic highlights the difficulty for college graduates to enter the high-tech industry, and the data indicates that a high proportion of these graduates tend to assume technological positions outside the high-tech industry, or non-technological positions in high-tech companies.

Analyzing this issue by company type underscores a significant difference between the number of university and college graduates across three key parameters:

  1. The R&D centers of multinational corporations tend to hire more university graduates – 72% compared with 56% in Israeli-owned companies.

  2. Company size has a positive effect on the tendency to employ workers with a university education. What stands out the most is that at very large corporations (more than 500 employees), 66% of new employees are university graduates, while in other companies this figure ranges from 55% (1-10 employees) and 59% (201-500 employees).

  3. As far as industry sectors are concerned, the percentage of university graduates was highest in the Life Sciences and Cleantech and Manufacturing & Industrial sectors, at 64% and 69%, respectively.

All these parameters were found to be statistically significant in a logistic regression designed to isolate the impact of each of the variables (for example, to examine whether the high percentage of multinational corporations employing university graduates does not actually result from their foreign ownership but rather the fact that they simply tend to be much larger).

There is also a higher percentage of university graduates for non-tech workers with an academic education; though, the difference here is less significant in comparison to the tech workers. Of this group, 51% are university graduates, while only 37% studied at colleges (12% studied at foreign educational institutions). This data does not significantly differ by sector or in relation to company size.


The connection between training and positions in the high-tech industry

A closer look at the educational background of employees in their first technological position in high-tech indicates that there are some positions that clearly require an academic degree. Thus, new workers in the software, hardware, and algorithms professions are mostly likely to have an academic education (Figure 4.3). In contrast, most workers in data and product/project management positions have academic backgrounds, but only one third of them have high-tech training. In comparison, the IT and QA professions rely extensively on extra-academic trainings.


Figure 4.3: Tech Employees Training for First High-Tech Position by Profession
Employees who began their role in 2018 and later

Source: Social Media Analysis

Extra-academic training

The role of extra-academic high-tech training (for example, programming bootcamps) as an alternative entry channel into high-tech has solidified in recent years. That said, as we have shown, the key entry channel into high-tech remains academic education. At the same time, it is interesting to see the breakdown of first jobs assumed by graduates of extra-academic training.

Figure 4.4 displays the breakdown by position of employees whose training was an extra-academic high-tech course, while distinguishing between those who also engaged in academic studies in addition to this training. As can be seen from this breakdown, workers without academic studies are more likely to be employed in technological positions (only 9% of them work in high-tech companies in non-tech positions, compared with 20% of individuals with academic studies). Furthermore, they are overrepresented in the QA and IT professions. On the other hand, it appears that workers with academic training have an advantage in the data and product/project management professions that require skillsets beyond programming.


Figure 4.4: First Position in High-Tech of Non-Academic High-Tech Training Graduates
Source: Social Media Analysis

Statistical Annex 🔽
Table 4.5: Regression - Likelihood of a University Graduate Given a Tech Employee with Academic High-Tech Training

Statistical Annex 🔼
Table 4.5: Regression - Likelihood of a University Graduate Given a Tech Employee with Academic High-Tech Training

Chapter 5:
Women’s participation in high-tech

  • keyboard_double_arrow_right

    According to CBS figures from 2012-2020, the percentage of women in high-tech of all employees increased by 0.7 percentage points, while the percentage of men increased over the same period by 2.6 percentage points – nearly four times greater.

  • keyboard_double_arrow_right

    The percentage of women was far higher in companies that grew at a rapid pace (over 20%) in the number of employees.

  • keyboard_double_arrow_right

    The Life Sciences and Cleantech sectors employ a much higher rate of female employees, and a higher percentage of women in R&D and R&D management roles.

  • keyboard_double_arrow_right

    Only 10% of companies reported having dedicated programs for recruiting women. On average, these companies had a higher rate of female R&D managers: 24% vs. 15% in companies that did not operate such programs.

In 2021, Israeli high-tech remained fairly homogenous. Jewish non-Orthodox men accounted for nearly two-thirds of all employees in the sector, while women, ultra-Orthodox, and Arabs remained under-represented (the latter two groups combined account for approximately 5% of high-tech employees).

This year’s survey included questions on women’s representation in tech. Based on the survey and data from social networks, in 2021 the percentage of women in tech remained low, at 25%-30% of all high-tech employees. The lack of improvement in this figure is one of the main obstacles to increasing the number of employees in the high-tech sector. In the last few years, there have been many discussions about increasing the number of high-tech employees out of total employees in the Israeli economy, a figure that currently stands at about 10%, according to CBS data. In the coalition agreements of the current government (the 36th) there is even a target of increasing this figure to 15% in a few years. However, examining this variable by gender reveals two different trends: the percentage of men is already close to the target, as in the last decade men’s share in high-tech employment grew from 11% to almost 14% out of all males in the labor force. Amongst women, however, the percentage rose only 0.7 percentage points and has remained around the 7% mark (see Figure 5.1).


Figure 5.1: High-Tech Employees' Share of the Labor Force
Source: CBS

This figure highlights the opportunity of integrating more women into the tech sector. If the percentage of women in high-tech out of all female employees in Israel would have grown by 2.6 percentage points (similar to the rise in the percentage of men), Israeli high-tech would have gained another full percentage point and would have approached 11.5% out of the total number of employees in the labor force.

To better understand the levels of women’s participation in high tech, we analyzed the data according to three pillars: (1) the percentage of women out of total employees in the organization (2) the percentage of women out of R&D employees, and (3) the percentage of women out of R&D management roles.

The Life Sciences and Cleantech Sectors exhibit high levels of women’s participation, compared to other sectors. Notably, companies in these sectors reported that 41% of their R&D managers were women.


Figure 5.2: Representation of Women by Company Sector
Source: Human Capital Survey

There was no statistically significant difference between multinational companies and local companies in terms of employment of women. The size of the company was also not a significant factor affecting the percentage of women in companies, except for very small companies (up to 10 employees), which employ on average only 20% women, 17% in R&D roles, and 9% in R&D management roles. This figure is consistent with the low number of female entrepreneurs (about 10%) and is yet another indication that the initial core team of a high-tech startup usually consists of a clear majority of men.

One notable result is that the percentage of women was substantially higher in companies that grew rapidly – with more than 20% growth in employees between July 2021 and January 2022. There are three plausible explanations to this finding: (1) companies with more women are more successful and therefore grow faster, (2) companies that recruit many employees in a short period of time must expand the talent pools from which they recruit talent and thus reach out to more diverse populations, and (3) companies that employ many women have certain characteristics, i.e., they offer a better work-life-balance and/or produce products or services that are easier to identify with and appeal to many people, thus enabling them to recruit more employees. We were not able to measure the individual effect of each of these explanations using our current data; additional research is therefore required to gain further understanding of this finding.


Figure 5.3: Share of Women, by Company Employment Growth Greater or Smaller than 20%
Source: Human Capital Survey

The survey also examined the effect of dedicated programs in high-tech companies for recruiting women. We found that only 10% of the companies have such programs. Surprisingly, those were not correlated with a higher percentage of women (see chart below). However, companies utilizing such programs had, on average, a higher percentage of women in R&D management roles (24% vs. 15%). It seems likely that women in managerial R&D roles are more inclined to call for the establishment of such programs.


Figure 5.3: Share of Women, by Whether Company Operates a Designated Recruitment Program for Women
Source: Human Capital Survey

To validate the above findings we ran a linear regression to explain the percentage of women out of total employees. The three variables mentioned above – companies with more than 10 employees, the Life Sciences and Cleantech sector, and companies which exhibited high growth were positive and significant. These finding remained even when the dependent variable was the percentage of women in R&D positions. The main difference in the third regression, aiming to explain the percentage of women in managerial R&D roles, was that the size of the company was significant only from 50 employees and above (and not 10).

Statistical Annex 🔽
Table 5.5: Share of Women in High-Tech by Position, Company Type and Designated Recruitment Program

Statistical Annex 🔼
Table 5.5: Share of Women in High-Tech by Position, Company Type and Designated Recruitment Program

Statistical Annex 🔽
Table 5.6: Share of Women by Position and Company Types

Statistical Annex 🔼
Table 5.6: Share of Women by Position and Company Types

Human Capital Activity - Start-Up Nation Central

Read more🔽

Close 🔼

Human Capital Activity - Israel Innovation Authority

Read more 🔽

Close 🔼

Contact us